Temperatures from California to the Dakotas are currently hovering around 9-12°F above average—but how bad is the situation compared to past years? This animated map by reddit user /NothingAbnormalHere provides a historical look at droughts in the U.S. since 1999, using data and graphics from the U.S. Drought Monitor (USDM).
What is the U.S. Drought Monitor?
Over the last two decades, the USDM has been tracking, measuring, and comparing droughts across America.
While droughts can be difficult to classify and standardize, there are various factors that can be used to gauge when a region is experiencing drought. These include measurements of snowpack levels, soil moisture, and recent precipitation.
To track these conditions (and make sense of them), the USDM synthesizes data from a plethora of meteorological sources, including the Palmer Drought Severity Index and the Standardized Precipitation Index.
From there, conditions are broken down into categories, ranging from D0 (abnormally dry) to D4 (Exceptional Drought). A map is released each week that shows which states are experiencing drought, and to what degree.
Where Are The Most Drought-Prone Areas?
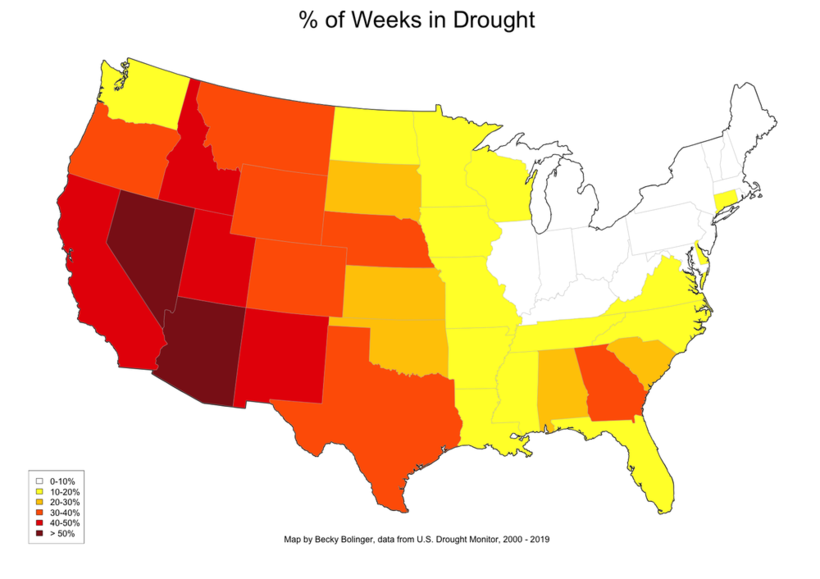
According to a map created by climatologist Becky Bolinger (which is published on Drought.gov), Arizona and Nevada are the most historically drought-prone states—the two have experienced drought more than 50% of the time tracked by the USDM.
California is high on the list as well, with the state experiencing drought at least 40% of the time.
As the historical data shows, the West is no stranger to droughts. However, this year’s drought has become particularly worrisome because of its intensity and breadth.
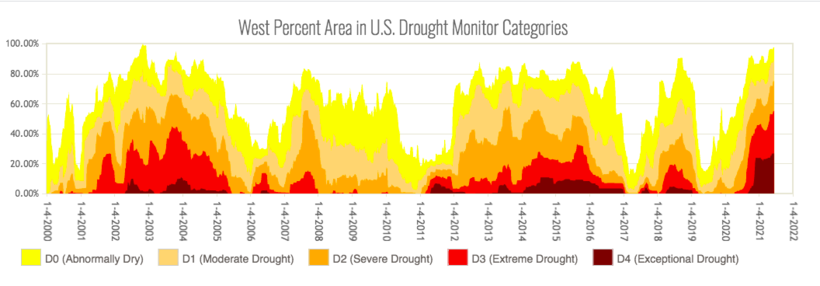
Right now, more than a quarter of the West is experiencing a D4 level drought—a new record. To help put things into perspective, here’s a look at how much overall land area in the West has been in drought, since 2000:
When a region is experiencing a D4 drought, possible impacts include:
Water Scarcity Lower reservoirs, combined with decreased snowpack lead to water shortages. Crop losses Water shortages mean less water for fields, which can lead to acres of fallow (unused) farmland. Wildfires Dry conditions and lack of moisture increase the risk of wildfires.
Is This the New Norm?
This record-breaking drought is wreaking havoc across the West. In California, reservoirs have about half as much water as they usually do, and crop failures are happening across Colorado.
The worst part? Some experts believe that this could be the new normal if human-driven climate change continues to increase average temperatures across the globe.
on
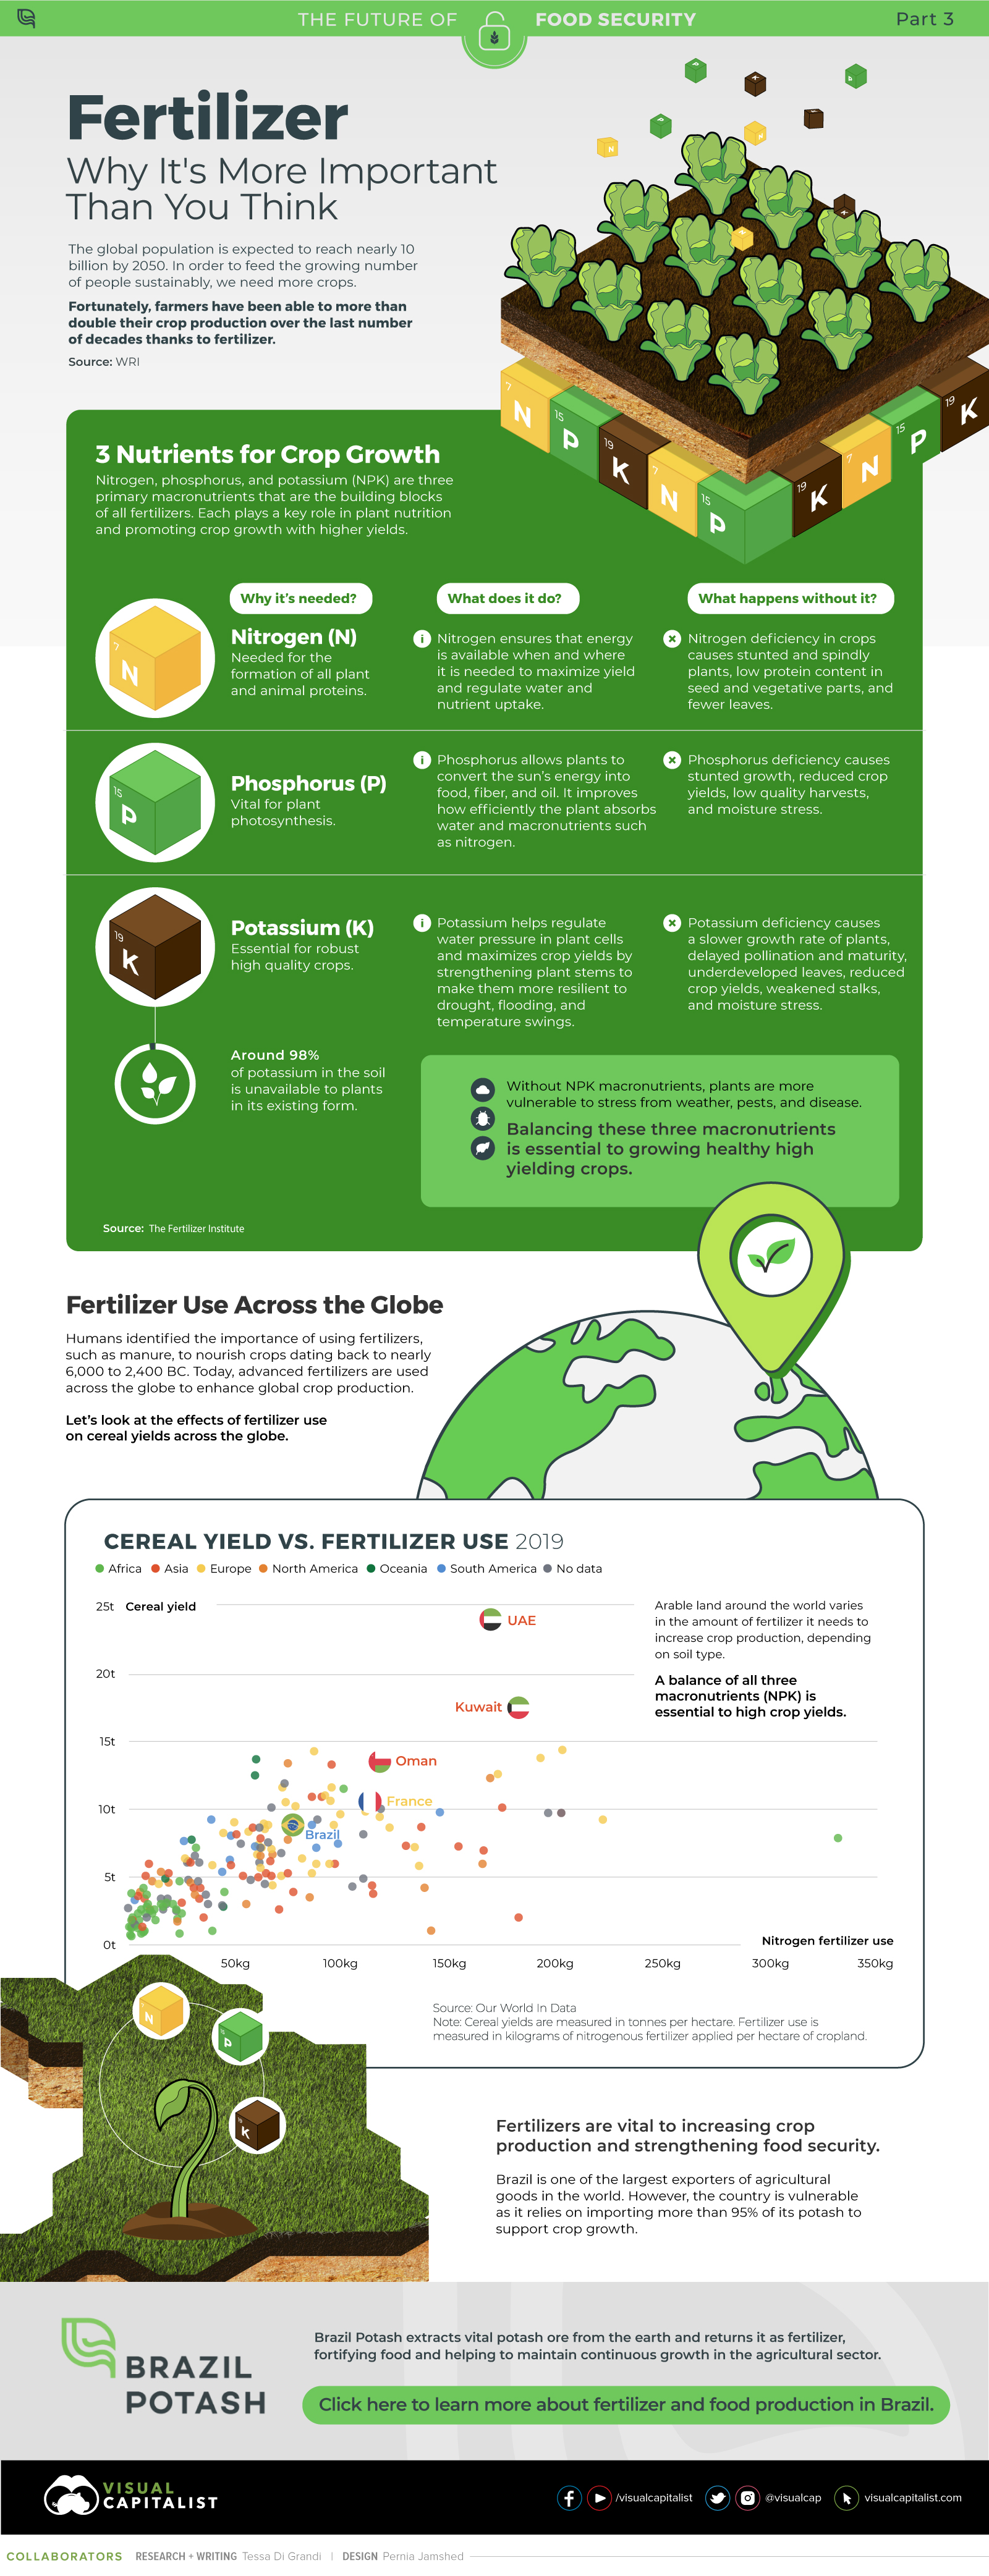
Over recent decades, farmers have been able to more than double their production of crops thanks to fertilizers and the vital nutrients they contain.
When crops are harvested, the essential nutrients are taken away with them to the dining table, resulting in the depletion of these nutrients in the soil. To replenish these nutrients, fertilizers are needed, and the cycle continues.
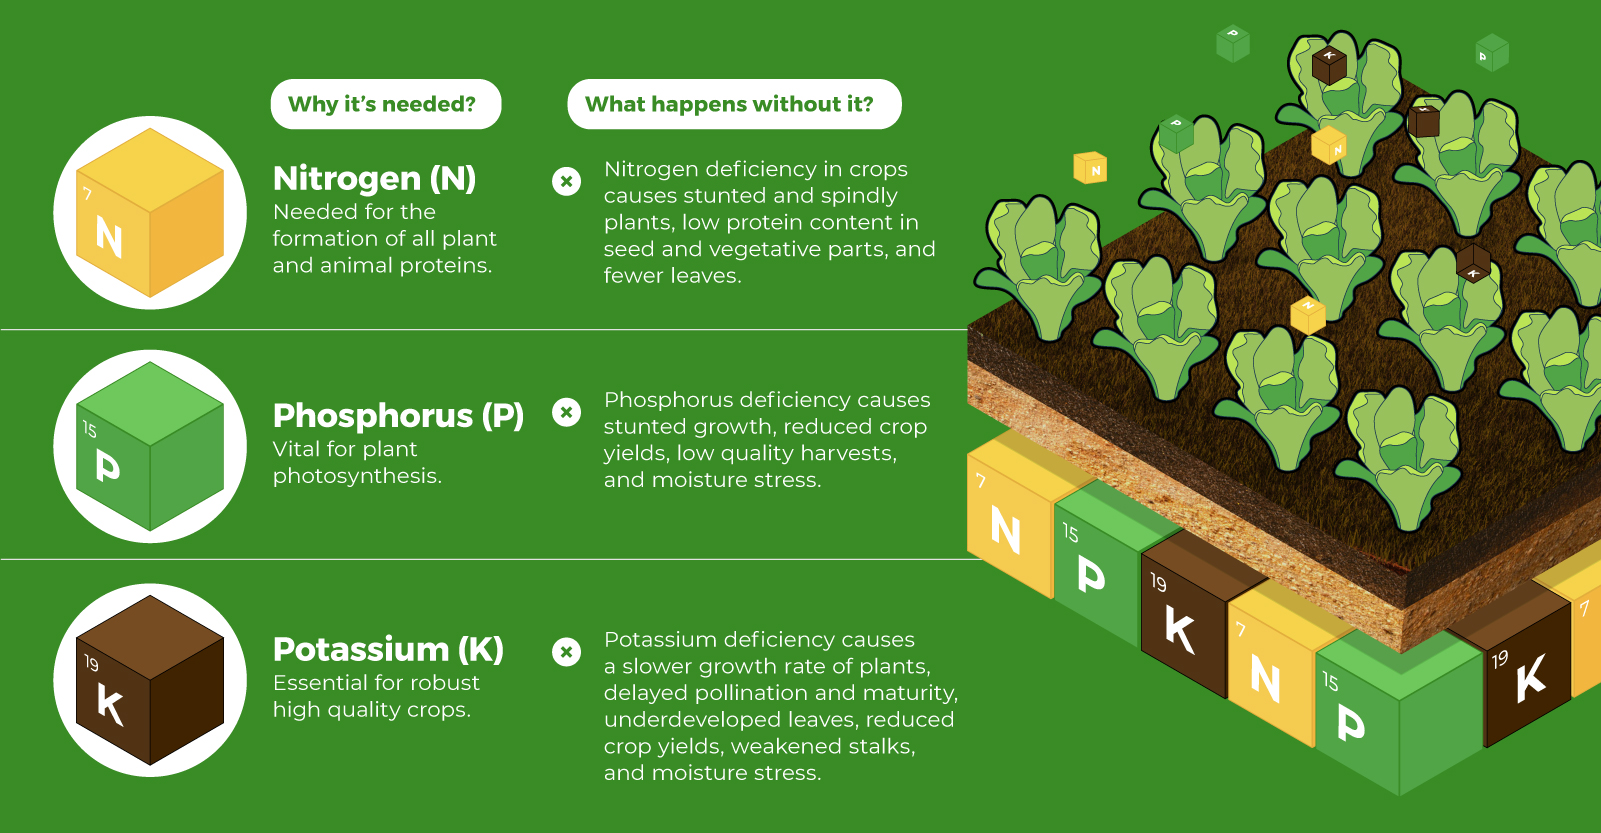
The above infographic by Brazil Potash shows the role that each macronutrient plays in growing healthy, high-yielding crops.
Food for Growth
Nitrogen, phosphorus, and potassium (NPK) are three primary macronutrients that are the building blocks of the global fertilizer industry. Each plays a key role in plant nutrition and promoting crop growth with higher yields. Let’s take a look at how each macronutrient affects plant growth. If crops lack NPK macronutrients, they become vulnerable to various stresses caused by weather conditions, pests, and diseases. Therefore, it is crucial to maintain a balance of all three macronutrients for the production of healthy, high-yielding crops.
The Importance of Fertilizers
Humans identified the importance of using fertilizers, such as manure, to nourish crops dating back to nearly 6,000 to 2,400 BC. As agriculture became more intensive and large-scale, farmers began to experiment with different types of fertilizers. Today advanced chemical fertilizers are used across the globe to enhance global crop production. There are a myriad of factors that affect soil type, and so the farmable land must have a healthy balance of all three macronutrients to support high-yielding, healthy crops. Consequently, arable land around the world varies in the amount and type of fertilizer it needs. Fertilizers play an integral role in strengthening food security, and a supply of locally available fertilizer is needed in supporting global food systems in an ever-growing world. Brazil is one of the largest exporters of agricultural goods in the world. However, the country is vulnerable as it relies on importing more than 95% of its potash to support crop growth. Brazil Potash is developing a new potash project in Brazil to ensure a stable domestic source of this nutrient-rich fertilizer critical for global food security. Click here to learn more about fertilizer and food production in Brazil.