While those odds might seem high, the truth is nearly everyone in the U.S. hails from someplace else if you look far back enough.
Visualizing U.S. Immigration
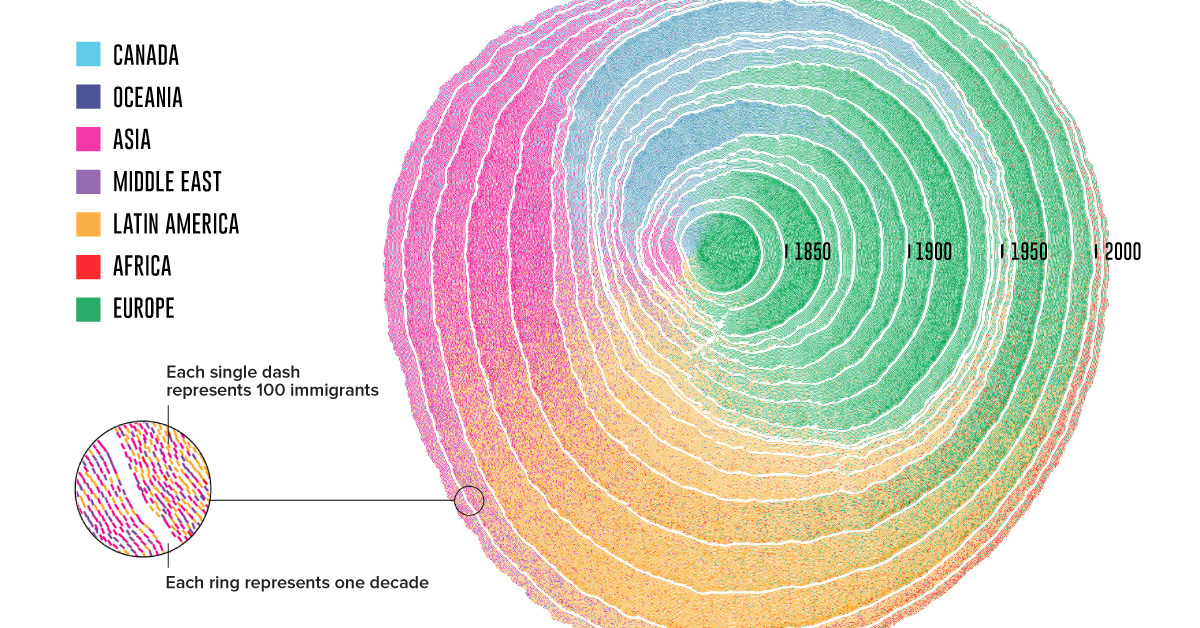
Today’s intriguing visualization was created by professors Pedro M. Cruz and John Wihbey from Northeastern University, and it depicts U.S. immigration from 1830 until 2015, as rings in a growing tree trunk.
The researchers turned registered U.S. Census data into an estimate for the total number of immigrants arriving each decade, and then the yearly figures in the visualization. One caveat is that it does not account for the populations of slaves, or indigenous communities.
From the Old to the New World
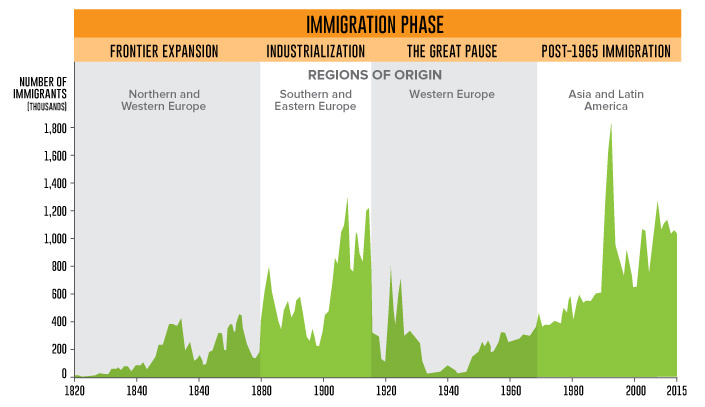
The pattern of U.S. immigration can be explained in four major waves overall:
The origins of U.S. immigrant populations transform from era to era. Which events influenced each wave?
Frontier Expansion: 1830-1880
Cheap farmland and the promise of economic growth in the first Industrial Revolution spurred large-scale immigration from Britain, Germany, and other parts of Central Europe. The Irish Potato Famine from 1845 to 1849 drove many immigrants from Ireland over to the U.S. The 1848 Treaty of Guadalupe ended the Mexican-American war, and extended U.S. citizenship to over 70,000 Mexican residents.
Industrialization: 1880-1915
Immigrant mobility increased with the introduction of large steam-powered ships. The expansion of railroads in Europe also made it easier for people to reach oceanic ports. On the other hand, the Chinese Exclusion act in 1882 prohibited Chinese laborers from entry. In 1892, the famous Ellis Island opened; the first federal immigration station provided a gateway for over 12 million people.
The Great Pause: 1915-1965
The Immigration Act of 1924 enacted quotas on immigrant numbers, restricting groups from countries in Southern and Eastern Europe, and virtually all immigrants of Asian origin. The Great Depression, and subsequent World Wars also complicated immigration matters as many came to seek refuge in the United States.
Post-1965 Immigration: 1965-Present
The Hart-Cellber (Immigration and Naturalization Act) of 1965 overturned all previous quotas based on national origin. Family unification and an increase in skilled labor were two major aims of this act. This decision significantly impacted the U.S. demographic makeup in the following decades, as more immigrants of Latin, Asian, and African descent entered the country.
E Pluribus Unum (From Many, One)
While others have mapped two centuries of immigration before, few have captured its sheer scale and impact quite as strikingly. The researchers explain their reasoning behind this metaphor of tree rings: It’s no wonder that this animation showing U.S. immigration won Gold for the “People, Language, and Identity” and “Most Beautiful” categories at the 2018 Kantar Information is Beautiful Awards. on Both figures surpassed analyst expectations by a wide margin, and in January, the unemployment rate hit a 53-year low of 3.4%. With the recent release of February’s numbers, unemployment is now reported at a slightly higher 3.6%. A low unemployment rate is a classic sign of a strong economy. However, as this visualization shows, unemployment often reaches a cyclical low point right before a recession materializes.
Reasons for the Trend
In an interview regarding the January jobs data, U.S. Treasury Secretary Janet Yellen made a bold statement: While there’s nothing wrong with this assessment, the trend we’ve highlighted suggests that Yellen may need to backtrack in the near future. So why do recessions tend to begin after unemployment bottoms out?
The Economic Cycle
The economic cycle refers to the economy’s natural tendency to fluctuate between periods of growth and recession. This can be thought of similarly to the four seasons in a year. An economy expands (spring), reaches a peak (summer), begins to contract (fall), then hits a trough (winter). With this in mind, it’s reasonable to assume that a cyclical low in the unemployment rate (peak employment) is simply a sign that the economy has reached a high point.
Monetary Policy
During periods of low unemployment, employers may have a harder time finding workers. This forces them to offer higher wages, which can contribute to inflation. For context, consider the labor shortage that emerged following the COVID-19 pandemic. We can see that U.S. wage growth (represented by a three-month moving average) has climbed substantially, and has held above 6% since March 2022. The Federal Reserve, whose mandate is to ensure price stability, will take measures to prevent inflation from climbing too far. In practice, this involves raising interest rates, which makes borrowing more expensive and dampens economic activity. Companies are less likely to expand, reducing investment and cutting jobs. Consumers, on the other hand, reduce the amount of large purchases they make. Because of these reactions, some believe that aggressive rate hikes by the Fed can either cause a recession, or make them worse. This is supported by recent research, which found that since 1950, central banks have been unable to slow inflation without a recession occurring shortly after.
Politicians Clash With Economists
The Fed has raised interest rates at an unprecedented pace since March 2022 to combat high inflation. More recently, Fed Chairman Jerome Powell warned that interest rates could be raised even higher than originally expected if inflation continues above target. Senator Elizabeth Warren expressed concern that this would cost Americans their jobs, and ultimately, cause a recession. Powell remains committed to bringing down inflation, but with the recent failures of Silicon Valley Bank and Signature Bank, some analysts believe there could be a pause coming in interest rate hikes. Editor’s note: just after publication of this article, it was confirmed that U.S. interest rates were hiked by 25 basis points (bps) by the Federal Reserve.