Even though the government’s primary objectives were arguably achieved through these extreme measures, it has been at an extraordinary human cost. The draconian enforcement of these policies, combined with the unintended consequences on families and the cultural preference for male children, will have an everlasting impact on the country’s future.
Wonky Demographics
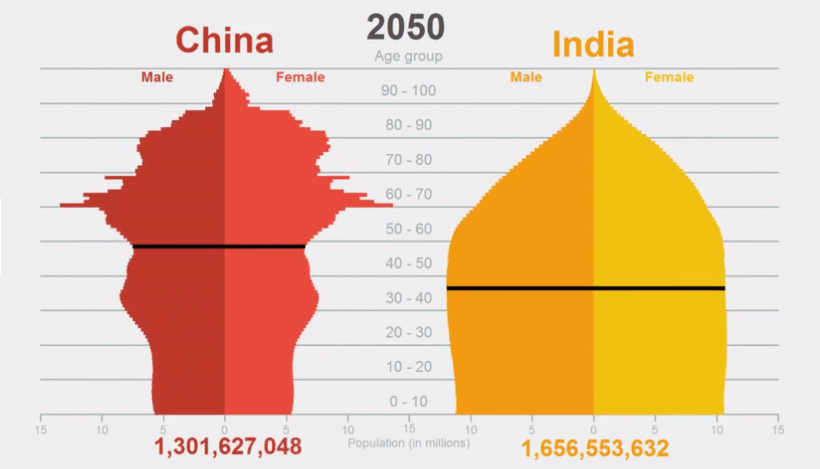
Fast forward to today, and the policy is still in place, but to a lesser effect. Since early 2016, families have been allowed to have two children – but even with this change in place, China still has a self-inflicted demographic disaster on its hands. In the below population pyramids created by Aron Strandberg, the very different trajectories of China and India are compared directly. China is not only skewing older and more male – it is also losing its strong base of younger workers that could potentially support the rest of the population.
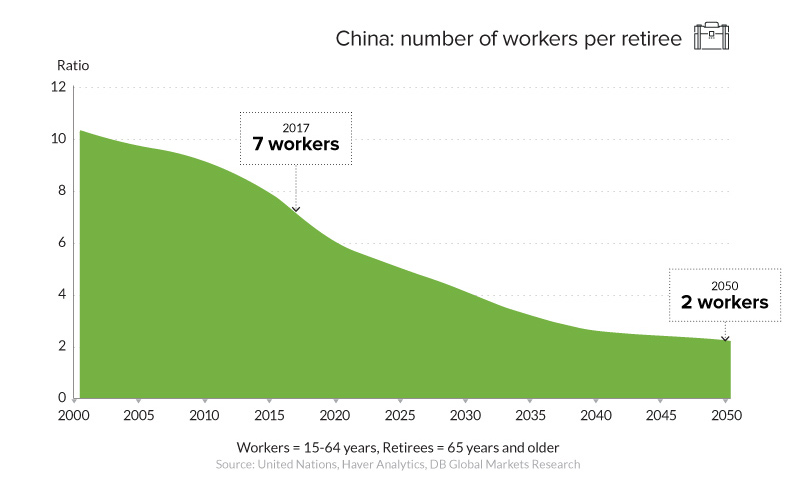
China’s “population pyramid” is not really a pyramid at all – in the coming decades, it’ll look more like a single pillar stuck propping up a burgeoning elderly demographic of people born before 1979. And over time, the unintended and ongoing effects of population control will be extremely impactful on China’s future. As one example of the emerging challenges, a recent estimate published in Scientific American pegged China’s shortage of women at 62 million, creating a situation where there’ll be millions of men who are unable to marry. This gender imbalance exacerbates an already existing shortfall at the younger end of China’s population spectrum – and the end result will be a rapidly falling ratio of workers to retirees in the Chinese economy:
Today, the ratio is roughly seven workers per retiree – and by 2050, when China’s population is 100 million people fewer than it is today, there will be just two workers per retiree.
A New Population Paradigm
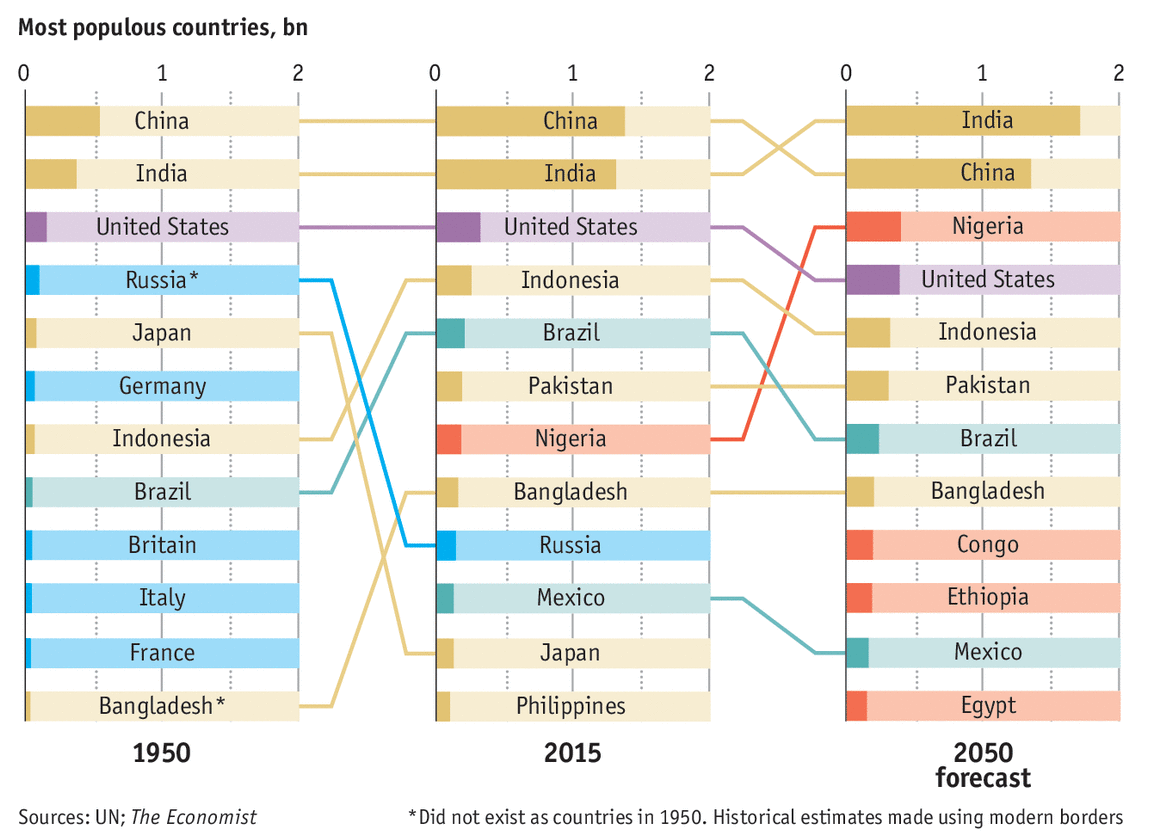
As China struggles with a declining population and a lack of young people, India is expected to takes its place as the most populous country in the world by roughly 2027.
This new paradigm will be an incredibly interesting one to watch. By the year 2100, China won’t be home to a single one of the world’s 20 most populous cities. Instead, these massive metropolises will almost exclusively be located in places like India and Africa – and some of them, like Mumbai, will hold 60 million or more inhabitants.
China’s New Hope
While this shift in global demographics is going to be extremely difficult to deal with for China, there is optimism that increasing levels of automation and the emergence of artificial intelligence will help make up for any shortfalls. The AI market alone is expected to drive $7 trillion in GDP growth by 2030, and China’s investments in robotics and automation are sure to keep the country a center of manufacturing in the future – even if those factories are being staffed with robots instead of workers. on These are in the form of Treasury securities, some of the most liquid assets worldwide. Central banks use them for foreign exchange reserves and private investors flock to them during flights to safety thanks to their perceived low default risk. Beyond these reasons, foreign investors may buy Treasuries as a store of value. They are often used as collateral during certain international trade transactions, or countries can use them to help manage exchange rate policy. For example, countries may buy Treasuries to protect their currency’s exchange rate from speculation. In the above graphic, we show the foreign holders of the U.S. national debt using data from the U.S. Department of the Treasury.
Top Foreign Holders of U.S. Debt
With $1.1 trillion in Treasury holdings, Japan is the largest foreign holder of U.S. debt. Japan surpassed China as the top holder in 2019 as China shed over $250 billion, or 30% of its holdings in four years. This bond offloading by China is the one way the country can manage the yuan’s exchange rate. This is because if it sells dollars, it can buy the yuan when the currency falls. At the same time, China doesn’t solely use the dollar to manage its currency—it now uses a basket of currencies. Here are the countries that hold the most U.S. debt: As the above table shows, the United Kingdom is the third highest holder, at over $655 billion in Treasuries. Across Europe, 13 countries are notable holders of these securities, the highest in any region, followed by Asia-Pacific at 11 different holders. A handful of small nations own a surprising amount of U.S. debt. With a population of 70,000, the Cayman Islands own a towering amount of Treasury bonds to the tune of $284 billion. There are more hedge funds domiciled in the Cayman Islands per capita than any other nation worldwide. In fact, the four smallest nations in the visualization above—Cayman Islands, Bermuda, Bahamas, and Luxembourg—have a combined population of just 1.2 million people, but own a staggering $741 billion in Treasuries.
Interest Rates and Treasury Market Dynamics
Over 2022, foreign demand for Treasuries sank 6% as higher interest rates and a strong U.S. dollar made owning these bonds less profitable. This is because rising interest rates on U.S. debt makes the present value of their future income payments lower. Meanwhile, their prices also fall. As the chart below shows, this drop in demand is a sharp reversal from 2018-2020, when demand jumped as interest rates hovered at historic lows. A similar trend took place in the decade after the 2008-09 financial crisis when U.S. debt holdings effectively tripled from $2 to $6 trillion.
Driving this trend was China’s rapid purchase of Treasuries, which ballooned from $100 billion in 2002 to a peak of $1.3 trillion in 2013. As the country’s exports and output expanded, it sold yuan and bought dollars to help alleviate exchange rate pressure on its currency. Fast-forward to today, and global interest-rate uncertainty—which in turn can impact national currency valuations and therefore demand for Treasuries—continues to be a factor impacting the future direction of foreign U.S. debt holdings.