In 1975, the median age in the United States was just 28 years old. However, it’s been rising fast as the Baby Boomers age, and it’s expected to break the 40 year mark by 2030. This shift is so fundamental that its ripples will be felt in almost every area imaginable. How we manage this change will have implications on the economy, culture, and politics – and it will almost certainly affect our personal wealth and investments, as well.
Visualizing Age in the U.S.
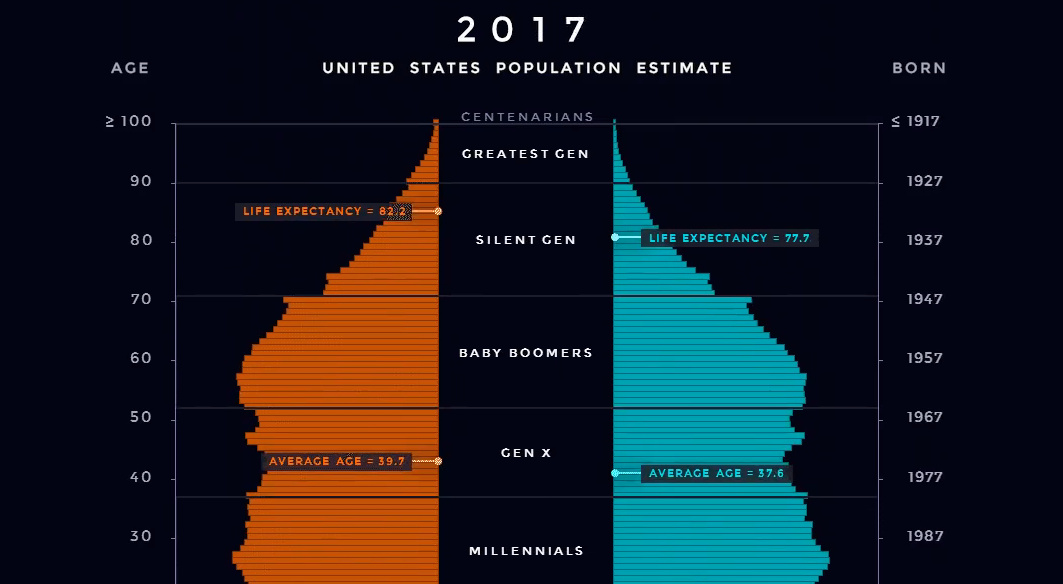
We’ve previously compared the population pyramids of China and India, but today we’re going to key in on the U.S. using a similar type of animation. Below is an animated population pyramid that shows how the U.S. population has been shifting, including projections up until 2050 based on data from the U.S. Census Bureau and World Bank.
Credit: Reddit user milamiso By 2050, the U.S. population will close in on 400 million people. As with most demographic data, viewing changes in the composition of this population through a visual lens helps to provide perspective.
Aging Population
One of the biggest differences in this particular chart can be seen in the 65+ year region. In the 1980s, only a small portion of the population fits there – but by the end, it’s becoming quite crowded. In more numerical terms – the number of Americans aged 65+ is projected to jump from 46 million today to over 98 million by 2060, and the 65+ age group’s share of the total population will rise to nearly 24%. This is mainly a function of a big generation (Baby Boomers) hitting their later years, and improved life expectancy and healthcare. According to the Population Reference Bureau, aging Baby Boomers could mean a massive 75% increase in number of Americans requiring nursing home care, from 1.3 million in 2010 to 2.3 million in 2030. Social Security and Medicare expenditures will also increase from 8% to 12% of GDP by 2050.
Fewer Babies
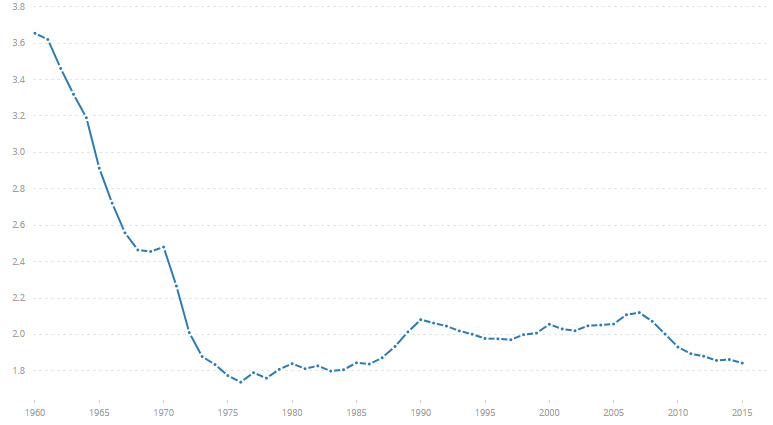
Another factor in the population equation is also lower fertility rates. U.S. Fertility Rate (births per woman) In the United States, the fertility rates that led to the Baby Boomer generation (born 1946-1964) have been long-gone for many decades now. Lately, fertility has been hovering closer to 1.8 births per woman. For reference, the replacement fertility rate is about 2.1 – meaning that without taking into account net immigration, each new generation will be smaller than the last. Unless something changes here (or with immigration policy), a more mature population will increasingly become the norm for the country.
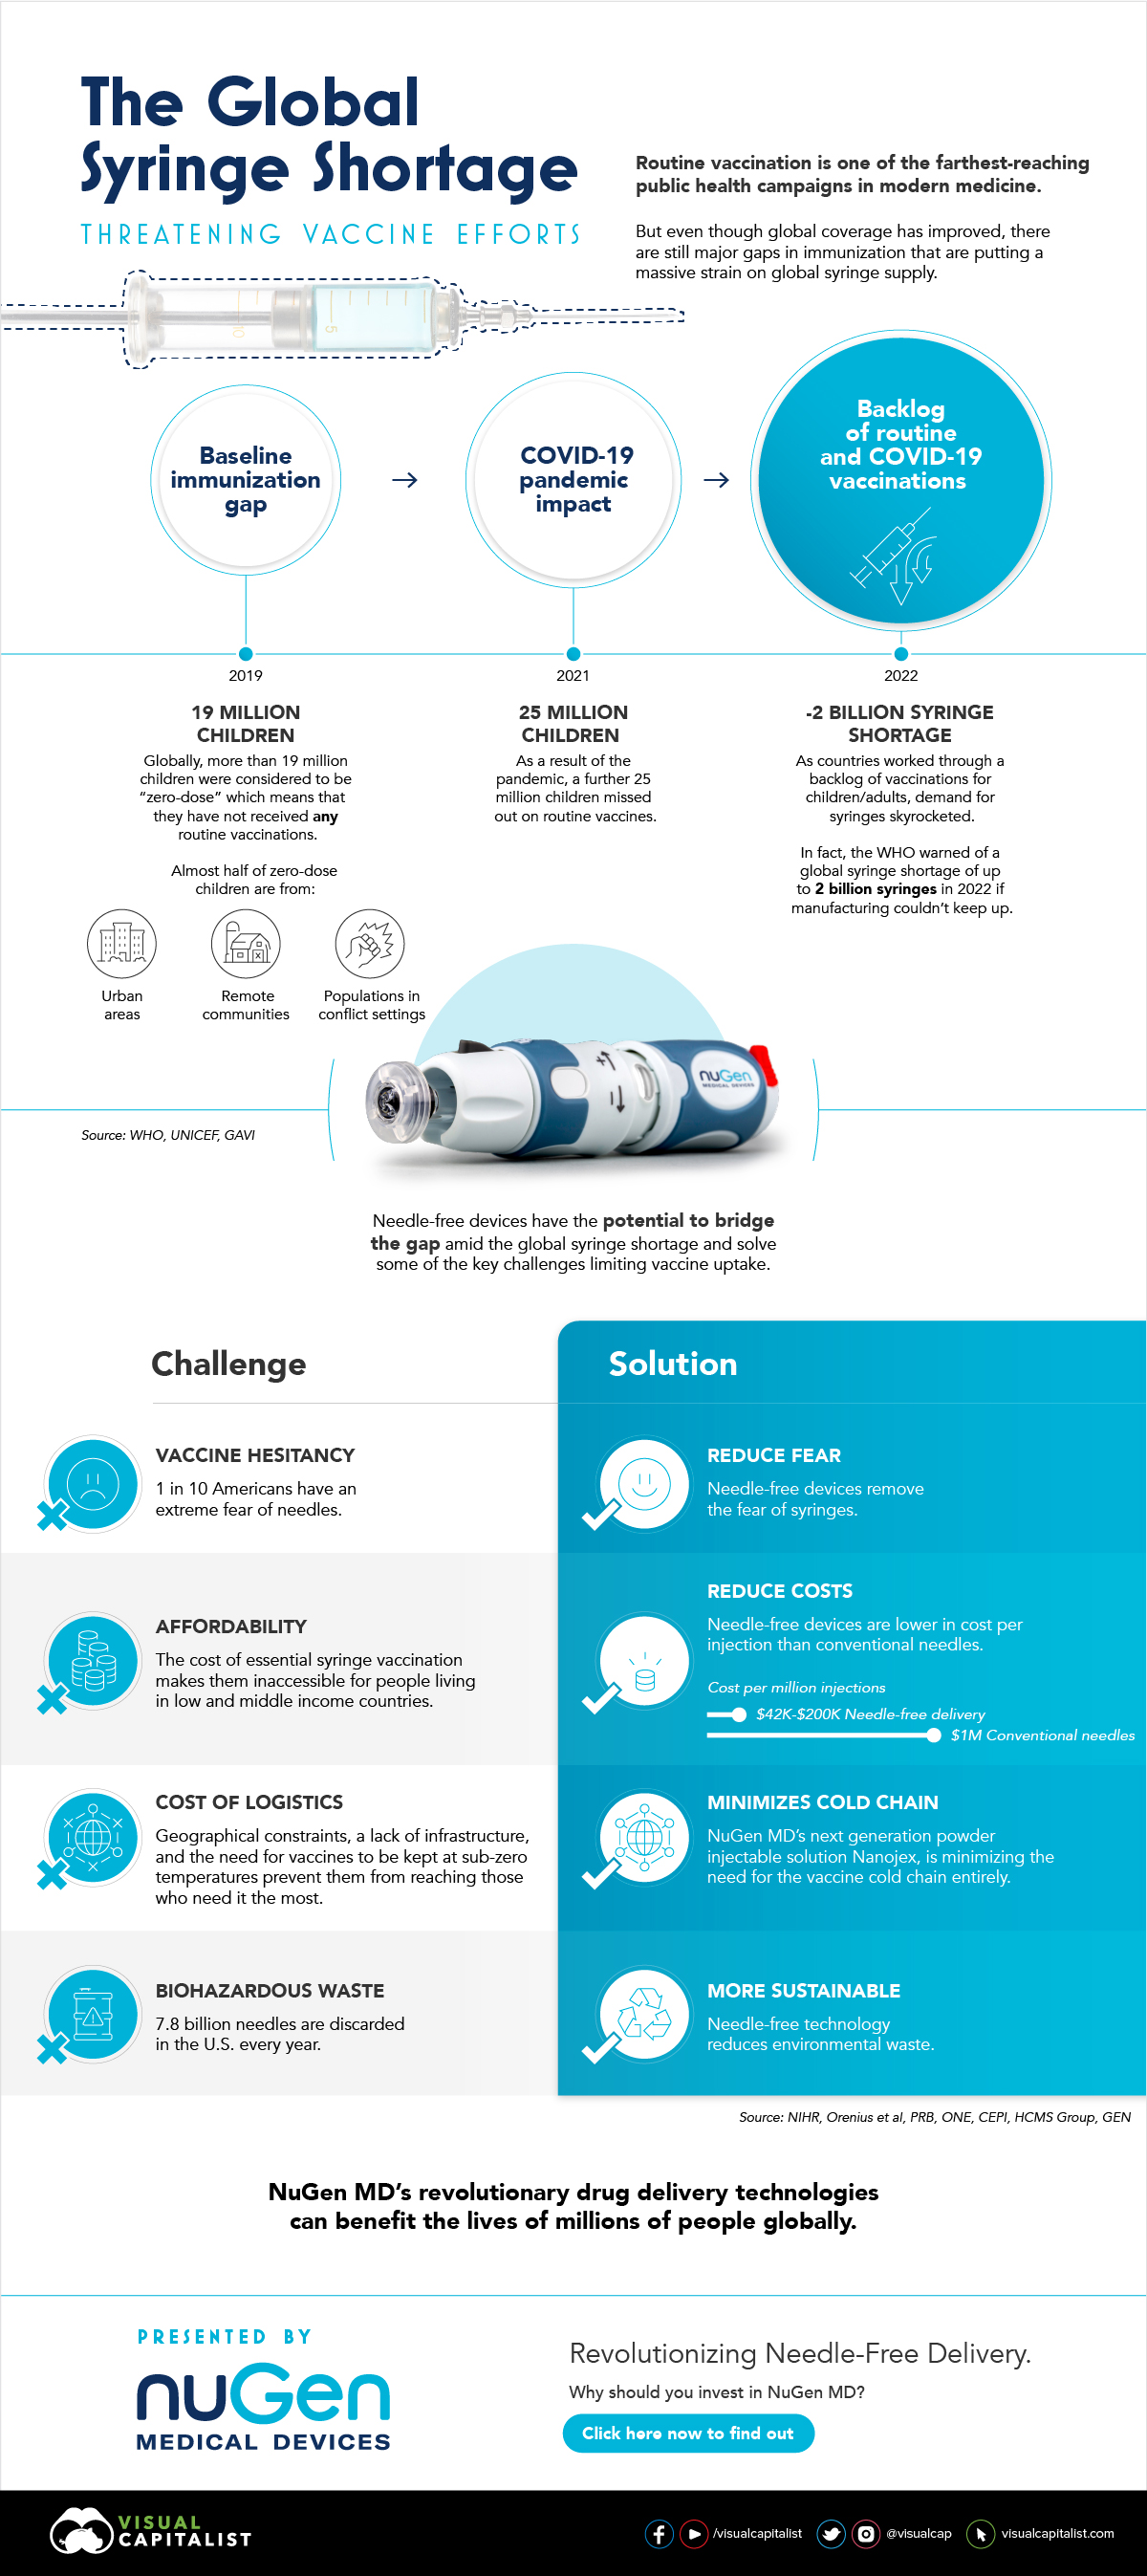
on In the above infographic from NuGen Medical Devices, we explore the factors leading to the syringe shortage and take a look at the company’s innovative needle-free solution that could play an important role in closing the immunization gap.
The Immunization Gap
Even before the COVID-19 pandemic, millions of people around the world struggled to get access to routine vaccinations. In fact, as of 2019 more than 19 million children around the world were considered to be “zero-dose” which means that they did not receive any routine vaccinations. Moreover, when the COVID-19 pandemic hit, global immunization dropped even further with 25 million children missing out on routine vaccines in 2021 alone.
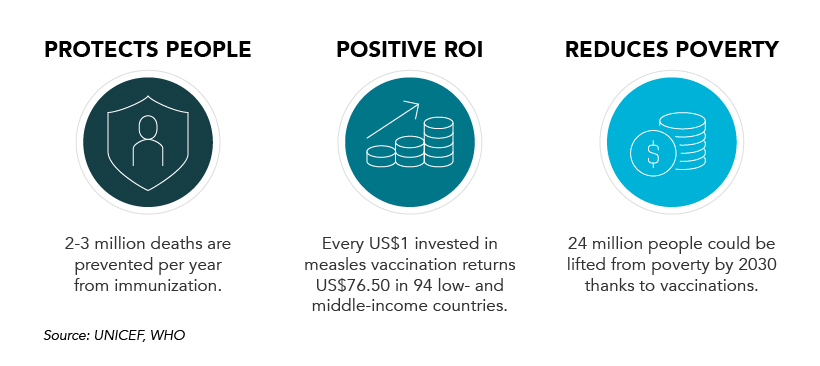
Why is Immunization So Important?
Vaccinations prevent against over 20 life-threatening diseases and save between 2-3 million deaths per year, making them—as the WHO describes—the foundation of healthcare systems and an indisputable human right. As countries work through a backlog of vaccinations to close the immunization gap that has worsened since the pandemic, demand for syringes has significantly increased.
The Result: A Global Syringe Deficit
In 2022, the WHO warned that we could see a shortage of up to 2 billion syringes if manufacturing can’t keep up. This could result in the severe disruption to routine vaccinations and promote unsafe recycling of syringes in order to administer vaccines. But the issue goes far beyond a supply shortage of syringes. COVID-19 has brought conventional syringe vaccines into sharp focus, with many criticizing the challenges associated with them. With conventional needles facing so many challenges, it’s no surprise that investors are taking interest in viable alternatives. What’s more, these alternatives don’t just apply to vaccinations, they can also work for people with diabetes, dentists, and pet care.
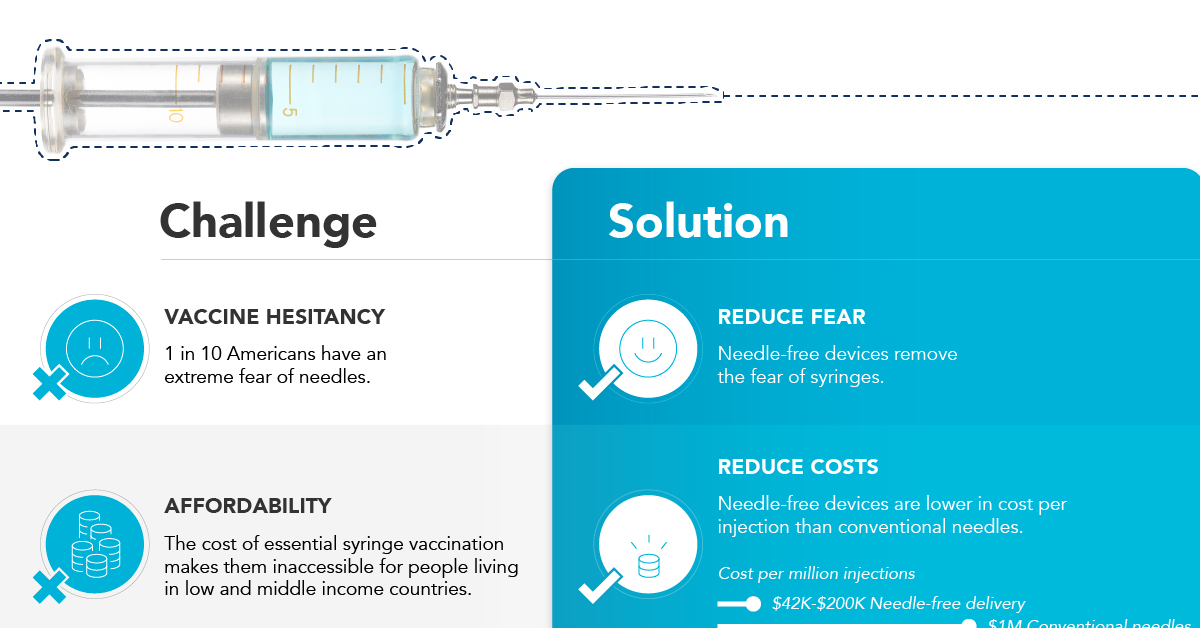
Enter Needle-free Devices from NuGen MD
Needle-free devices have the potential to bridge the gap in immunization amid the global syringe shortage, solve some of the key challenges limiting vaccine uptake, and more importantly, benefit the lives of millions of people.
How Do They Work?
NuGen’s needle-free devices use a simple spring-loaded mechanism which uses pressure to release the liquid drug and penetrate the skin. In less than one-tenth of a second, the drug is dispensed more safely and evenly compared to needle syringes. It’s also virtually painless and leaves no mark on the skin.
Interested in investing in NuGen Medical Devices? To learn more about their plans to pioneer the future of needle-free drug delivery, click this link now.