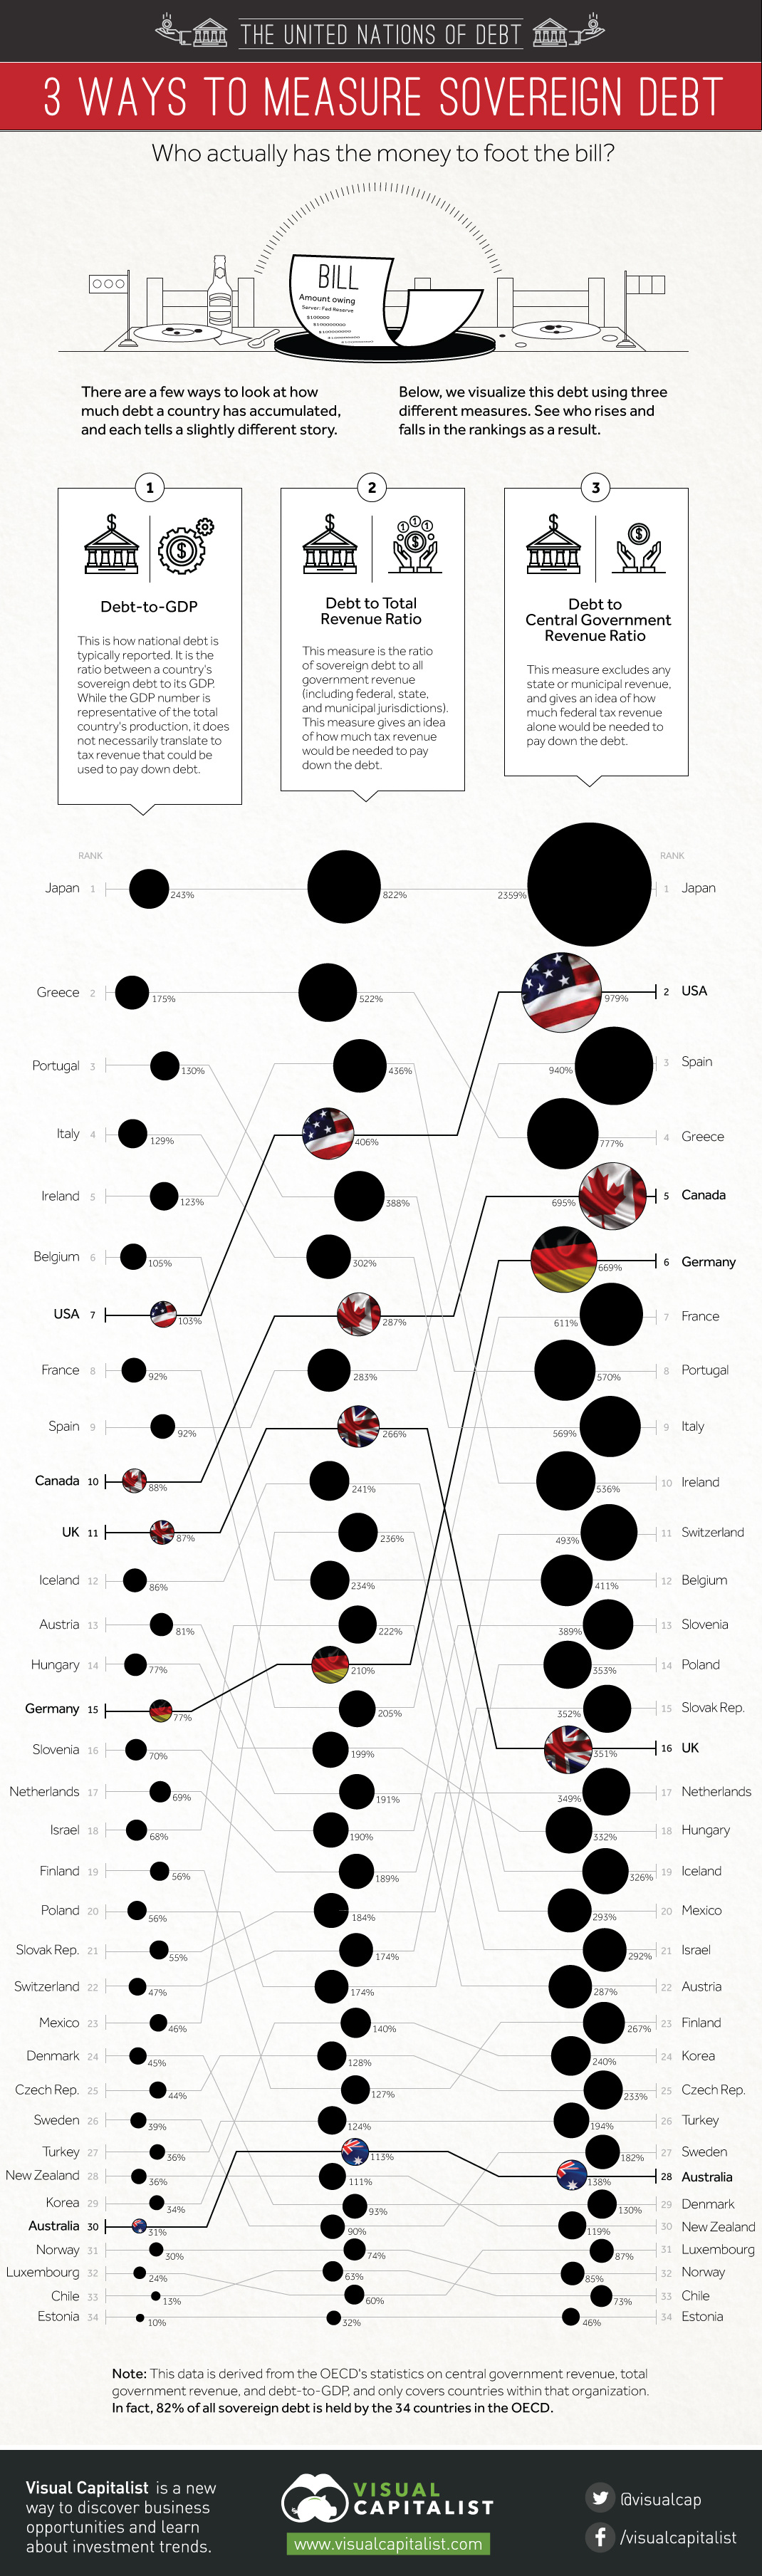
By This Measure, the U.S. has the 2nd Highest National Debt
USA is #7 in debt to gdp, but #2 in debt to revenue
In absolute terms, the United States is the most indebted country in the world, accounting for 29% of the world’s $60 trillion of sovereign debt. However, this is not really a fair comparison in some ways because it does not account for the relative wealth of the country in contrast to poorer economies. That’s why it is standard practice to measure sovereign debt in a ratio comparing it directly to the economic productivity, measured by gross domestic product (GDP). Using this ratio in comparison with other OECD countries, the United States is a modest 7th place (out of 34) in the rankings in terms of its debt load. However, as Jeffrey Dorfman writes in Forbes, comparing debt and GDP has some considerable problems. The major issue is that economic production cannot be converted directly to dollars that a government can spend. If this were true, a government could claim everyone’s income as taxes and use it to pay down the debt. However, in reality, a 100% tax rate would make everyone would quit their jobs or leave the country. That’s why it makes more sense to compare a government’s debt to the actual tax revenue collected, as this creates a clearer picture of the country’s debt burden and the capacity to pay. We pulled the latest data from the OECD to compare three ways of measuring the amount of debt that a country has accumulated. The first is the standard Debt to GDP ratio. In addition, we looked at Debt to Revenue (this includes all federal, state, and municipal tax revenues) as well as Debt to Central Government Revenue (this excludes state and municipal tax revenue). The data from the OECD database is from 2013. When tabulated using all three measures, the world debt picture changes significantly. The United States is 7th in Debt to GDP with a ratio of 103%, but it jumps to 4th place (406%) in terms of Debt to Revenue, and then 2nd place (979%) in terms of Debt to Central Government Revenue. In other words, when it comes to the actual capacity to pay down this debt, the United States is the second most indebted country in the world. Even if the federal government theoretically used all tax revenue to pay down debt, it would take 10 years (not including any interest). Of course, the United States also has the world’s reserve currency for now, which gives it more flexibility with its debt and monetary policy. This is less true for a country like Greece, where the currency cannot be devalued at all so long as the country is a part of the EU. How do other major countries do when comparing the regular measure to the new one using revenue? Canada jumps five spots to 5th place with 695%, and Germany jumps nine spots to 6th place. The UK drops five spots down to 16th overall with 351%. Australia rises two spots from 30th to 28th.
on The good news is that the Federal Reserve, U.S. Treasury, and Federal Deposit Insurance Corporation are taking action to restore confidence and take the appropriate measures to help provide stability in the market. With this in mind, the above infographic from New York Life Investments looks at the factors that impact bonds, how different types of bonds have historically performed across market environments, and the current bond market volatility in a broader context.
Bond Market Returns
Bonds had a historic year in 2022, posting one of the worst returns ever recorded. As interest rates rose at the fastest pace in 40 years, it pushed bond prices lower due to their inverse relationship. In a rare year, bonds dropped 13%.
Source: FactSet, 01/02/2023.
Bond prices are only one part of a bond’s total return—the other looks at the income a bond provides. As interest rates have increased in the last year, it has driven higher bond yields in 2023.
Source: YCharts, 3/20/2023.
With this recent performance in mind, let’s look at some other key factors that impact the bond market.
Factors Impacting Bond Markets
Interest rates play a central role in bond market dynamics. This is because they affect a bond’s price. When rates are rising, existing bonds with lower rates are less valuable and prices decline. When rates are dropping, existing bonds with higher rates are more valuable and their prices rise. In March, the Federal Reserve raised rates 25 basis points to fall within the 4.75%-5.00% range, a level not seen since September 2007. Here are projections for where the federal funds rate is headed in 2023:
Federal Reserve Projection*: 5.1% Economist Projections**: 5.3%
*Based on median estimates in the March summary of quarterly economic projections.**Projections based on March 10-15 Bloomberg economist survey. Together, interest rates and the macroenvironment can have a positive or negative effect on bonds.
Positive
Here are three variables that may affect bond prices in a positive direction:
Lower Inflation: Reduces likelihood of interest rate hikes. Lower Interest Rates: When rates are falling, bond prices are typically higher. Recession: Can prompt a cut in interest rates, boosting bond prices.
Negative
On the other hand, here are variables that may negatively impact bond prices:
Higher Inflation: Can increase the likelihood of the Federal Reserve to raise interest rates. Rising Interest Rates: Interest rate hikes lead bond prices to fall. Weaker Fundamentals: When a bond’s credit risk gets worse, its price can drop. Credit risk indicates the chance of a default, the risk of a bond issuer not making interest payments within a given time period.
Bonds have been impacted by these negative factors since inflation started rising in March 2021.
Fixed Income Opportunities
Below, we show the types of bonds that have had the best performance during rising rates and recessions.
Source: Derek Horstmeyer, George Mason University 12/3/2022. As we can see, U.S. ultrashort bonds performed the best during rising rates. Mortgage bonds outperformed during recessions, averaging 11.4% returns, but with higher volatility. U.S. long-term bonds had 7.7% average returns, the best across all market conditions. In fact, they were also a close second during recessions. When rates are rising, ultrashort bonds allow investors to capture higher rates when they mature, often with lower historical volatility.
A Closer Look at Bond Market Volatility
While bond market volatility has jumped this year, current dislocations may provide investment opportunities. Bond dislocations allow investors to buy at lower prices, factoring in that the fundamental quality of the bond remains strong. With this in mind, here are two areas of the bond market that may provide opportunities for investors:
Investment-Grade Corporate Bonds: Higher credit quality makes them potentially less vulnerable to increasing interest rates. Intermediate Bonds (2-10 Years): Allow investors to lock in higher rates.
Both types of bonds focus on quality and capturing higher yields when faced with challenging market conditions.
Finding the Upside
Much of the volatility seen in the banking sector was due to banks buying bonds during the pandemic—or even earlier—at a time when interest rates were historically low. Since then, rates have climbed considerably. Should rates moderate or stop increasing, this may present better market conditions for bonds. In this way, today’s steep discount in bond markets may present an attractive opportunity for price appreciation. At the same time, investors can potentially lock in strong yields as inflation may subside in the coming years ahead. Learn more about bond investing strategies with New York Life Investments.