Can Uranium be Great Again?
Uranium miners up 59% since election on pro-nuclear hopes
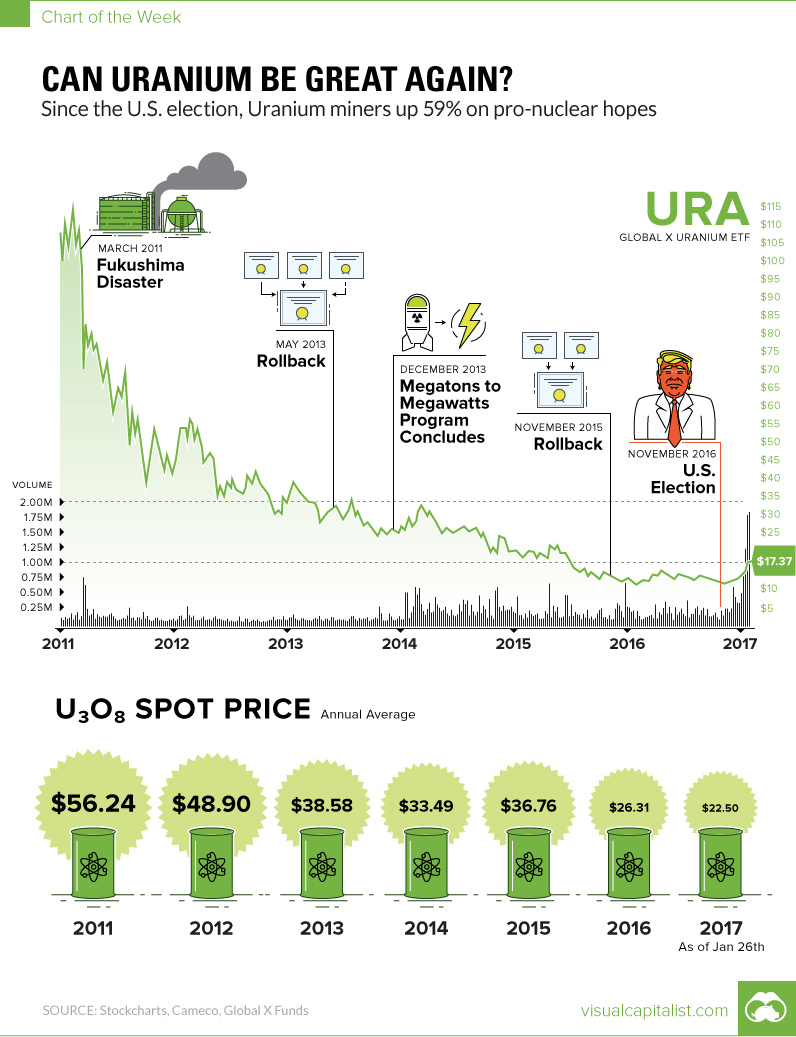
The Chart of the Week is a weekly Visual Capitalist feature on Fridays. Uranium’s spot price had a rough ride throughout the course of 2016, but for many investors there is suddenly a new aura of optimism around the troubled metal. It all starts with Donald Trump’s “America First” strategy, which is being perceived by many as a potential boon to the uranium sector. Official details are slim, but industry executives are currently speculating that the Trump administration will be better for nuclear power than the previous government. If that’s true, then it would mean far less regulatory hurdles for nuclear power, and likely even funding to bring more power plants online in the United States.
A Shot in the Arm
Perhaps such a catalyst is just what the metal needed. Both the spot price and the share prices of uranium miners have been in a gruesome bear market ever since the 2011 Fukushima incident in Japan. The prolonged pain has weathered down investors and companies alike, but everything has to bottom at some point. As David Erfle from Kitco pointed out last week, the chart for the the Global X Uranium ETF (URA) makes any other downturn look like a piece of cake. The ETF, which tracks global uranium miners, has lost a whopping 90% of its value over the last six years, including two rollbacks (in 2013 and 2015). Lately, thanks to the “Trump bump” and a 10% production cut in Kazakhstan announced earlier this month, the URA is suddenly buzzing with volume. The ETF is now back up on its feet, gaining a solid 59% since the election.
But Can Uranium Be Great Again?
A bounce in uranium stocks is something that was way overdue. However, if nuclear-related announcements aren’t made soon from the Trump administration, the newfound optimism could fade pretty fast. Statistically speaking, the World Health Organization says that nuclear power kills less people per terawatt hour than any other major source of power, even rooftop solar. Nuclear is also friendly from an emissions perspective: using a life-cycle emissions analysis, nuclear generates similar emissions to wind or hydropower. The problem, of course, lies in the fat tail risk of a nuclear catastrophe, which is something that is still fresh in people’s minds in the wake of Fukushima. Whether nuclear and uranium can be great again depends on the public’s tolerance for such projects, as well as a significant amount of support from the government to push new projects through. The rally is much welcomed by uranium investors – but it will remain unclear if it has any long-term legs until these two considerations are met. on Last year, stock and bond returns tumbled after the Federal Reserve hiked interest rates at the fastest speed in 40 years. It was the first time in decades that both asset classes posted negative annual investment returns in tandem. Over four decades, this has happened 2.4% of the time across any 12-month rolling period. To look at how various stock and bond asset allocations have performed over history—and their broader correlations—the above graphic charts their best, worst, and average returns, using data from Vanguard.
How Has Asset Allocation Impacted Returns?
Based on data between 1926 and 2019, the table below looks at the spectrum of market returns of different asset allocations:
We can see that a portfolio made entirely of stocks returned 10.3% on average, the highest across all asset allocations. Of course, this came with wider return variance, hitting an annual low of -43% and a high of 54%.
A traditional 60/40 portfolio—which has lost its luster in recent years as low interest rates have led to lower bond returns—saw an average historical return of 8.8%. As interest rates have climbed in recent years, this may widen its appeal once again as bond returns may rise.
Meanwhile, a 100% bond portfolio averaged 5.3% in annual returns over the period. Bonds typically serve as a hedge against portfolio losses thanks to their typically negative historical correlation to stocks.
A Closer Look at Historical Correlations
To understand how 2022 was an outlier in terms of asset correlations we can look at the graphic below:
The last time stocks and bonds moved together in a negative direction was in 1969. At the time, inflation was accelerating and the Fed was hiking interest rates to cool rising costs. In fact, historically, when inflation surges, stocks and bonds have often moved in similar directions. Underscoring this divergence is real interest rate volatility. When real interest rates are a driving force in the market, as we have seen in the last year, it hurts both stock and bond returns. This is because higher interest rates can reduce the future cash flows of these investments. Adding another layer is the level of risk appetite among investors. When the economic outlook is uncertain and interest rate volatility is high, investors are more likely to take risk off their portfolios and demand higher returns for taking on higher risk. This can push down equity and bond prices. On the other hand, if the economic outlook is positive, investors may be willing to take on more risk, in turn potentially boosting equity prices.
Current Investment Returns in Context
Today, financial markets are seeing sharp swings as the ripple effects of higher interest rates are sinking in. For investors, historical data provides insight on long-term asset allocation trends. Over the last century, cycles of high interest rates have come and gone. Both equity and bond investment returns have been resilient for investors who stay the course.


