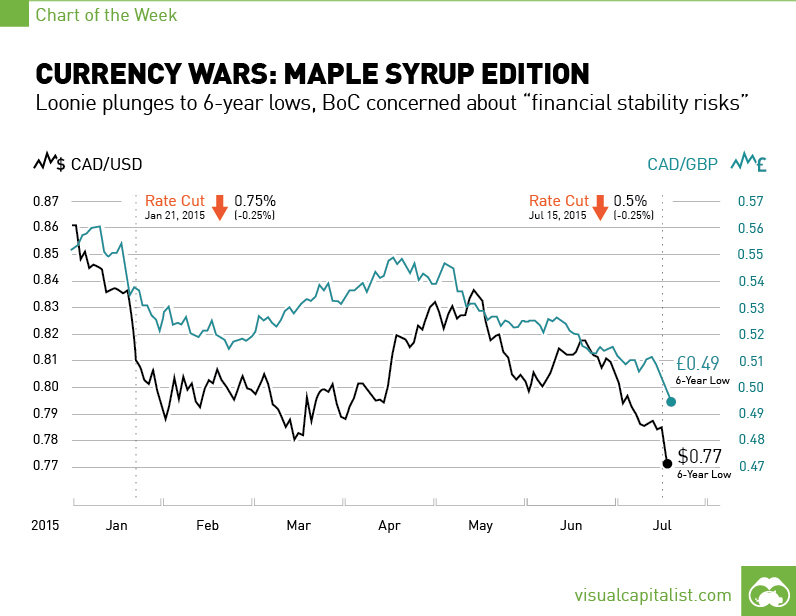
Currency Wars: The Maple Syrup Edition [Chart]
Loonie plunges to 6-year lows, BoC concerned about “financial stability risks”
The Chart of the Week is a weekly feature in Visual Capitalist on Fridays. Global monetary policy these days is a fast moving stream. It’s far easier to paddle along with the current and simply hope that there are no waterfalls or sharp rocks further down the way. That’s why two days ago, the Bank of Canada decided to cut its overnight rate for the second time in the last six months. Rates now stand at 0.5%, and the the last time they were this low was during an emergency one-year stretch at the tail end of the Great Recession. The Canadian dollar reacted as expected. The currency had gotten thoroughly crushed in trading since the beginning of the year, and the hammering didn’t stop after the rate announcement. It accelerated, putting the Canadian dollar at six-year lows in terms of dollars and pounds. It’s now down -10.2% to the US dollar and -10.4% to the pound sterling year-to-date. Somehow the loonie even managed to lose ground (-0.72%) to the euro, which is currently in the middle of a historic crisis.
All is Fair in Love and War
Even though it is knowingly participating in an ongoing currency war, Canada doesn’t really have a reputation for being a particularly aggressive nation. Heck, Prime Minister Stephen Harper has even been compared to “Jesus” for his saintly efforts in pushing through draconian terror legislation. So why the rate cuts and competitive devaluation? The problem is that it is a “Prisoner’s Dilemma” from a global macro perspective: when every other country is either creating money out of thin air, cutting rates, using monetary stimulus, or borrowing extra debt, it makes it extremely difficult to go against the grain. Imagine playing the board game Monopoly in which other players amend the rules so they can take money straight from the bank. If you don’t follow suit, you’re going to lose. It’s not that countries like Canada want to be in a currency war of competitive devaluation. These rate decisions always seem like a good idea in isolation because the situation always forces the central bank’s hand. We don’t blame the Bank of Canada for the decision itself – it is simply the inevitable result of loose and ineffective monetary policy worldwide that is spiraling out of control. The gamble of this vicious cycle has been that global growth would resume and the status quo could be pieced back together. Instead, Canada finds itself in the middle of a technical recession with two consecutive quarters of negative growth, crashing commodity prices, an iffy recovery for the United States, and the eurozone held together by a thread. Against that backdrop, there’s only one thing to do: cut rates again!
“Financial Stability Risks”
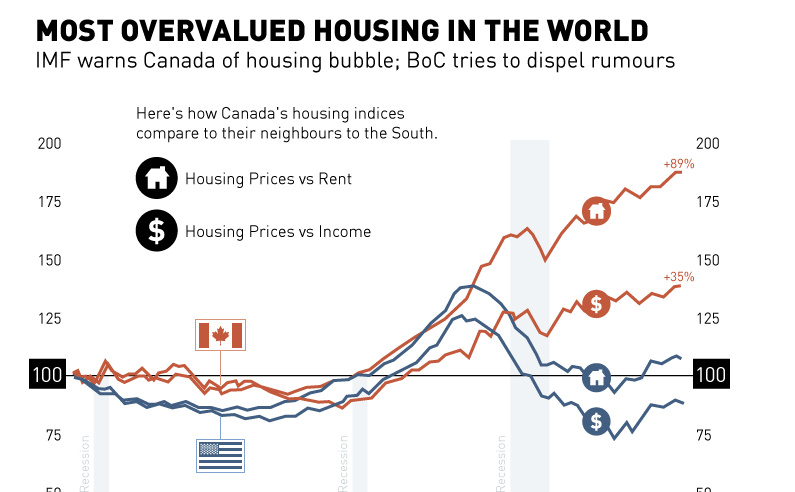
There are some interesting side effects that bubble to the top during all of this rate-cutting business. Forget the effects worldwide – to see the results of this policy, one only needs to look domestically within Canada. Even despite the Canadian economy treading water as of late, there are two concerning metrics that have been peaking. Firstly, the Canadian housing market is the most overvalued in the world. Even last month, it continued to set records on the back of Chinese buying, with Vancouver closing 29.1% more sales in June than the 10-year average. In Toronto, luxury market sales have sailed 56% over the first six months of the year. This is what happens when the cost of money is zero. Second, household debt for Canadians has reached an alarming 163.3% of disposable income. Since 2007, it is estimated that only Greece has grown its household debt more than Canada. Further, a recent report by BMO says that Canadian households carry an average of $92,699 in debt, and pay $1,165 each month to service it. In the poll, respondents said that if interest rates were raised two percentage points, that 64% of them would feel “stressed” servicing their debt. One quarter of respondents would feel “very stressed” if that happened. A two percent increase at the time of the poll would have brought the benchmark interest rate to 2.75%, which is basically the lowest it ever bottomed at in the ’80s and ’90s. Stephen Poloz, the Governor of the Bank of Canada, is aware of these concerns. “Financial stability risks remain elevated,” Governor Stephen Poloz told reporters on the day of the rate cuts. “Of particular note are the vulnerabilities associated with household debt and rising housing prices. And we must acknowledge that today’s action could exacerbate these vulnerabilities.” Paddle away, Mr. Poloz. Let’s hope there’s no rocky spots downstream that could capsize the boat.
on Last year, stock and bond returns tumbled after the Federal Reserve hiked interest rates at the fastest speed in 40 years. It was the first time in decades that both asset classes posted negative annual investment returns in tandem. Over four decades, this has happened 2.4% of the time across any 12-month rolling period. To look at how various stock and bond asset allocations have performed over history—and their broader correlations—the above graphic charts their best, worst, and average returns, using data from Vanguard.
How Has Asset Allocation Impacted Returns?
Based on data between 1926 and 2019, the table below looks at the spectrum of market returns of different asset allocations:
We can see that a portfolio made entirely of stocks returned 10.3% on average, the highest across all asset allocations. Of course, this came with wider return variance, hitting an annual low of -43% and a high of 54%.
A traditional 60/40 portfolio—which has lost its luster in recent years as low interest rates have led to lower bond returns—saw an average historical return of 8.8%. As interest rates have climbed in recent years, this may widen its appeal once again as bond returns may rise.
Meanwhile, a 100% bond portfolio averaged 5.3% in annual returns over the period. Bonds typically serve as a hedge against portfolio losses thanks to their typically negative historical correlation to stocks.
A Closer Look at Historical Correlations
To understand how 2022 was an outlier in terms of asset correlations we can look at the graphic below:
The last time stocks and bonds moved together in a negative direction was in 1969. At the time, inflation was accelerating and the Fed was hiking interest rates to cool rising costs. In fact, historically, when inflation surges, stocks and bonds have often moved in similar directions. Underscoring this divergence is real interest rate volatility. When real interest rates are a driving force in the market, as we have seen in the last year, it hurts both stock and bond returns. This is because higher interest rates can reduce the future cash flows of these investments. Adding another layer is the level of risk appetite among investors. When the economic outlook is uncertain and interest rate volatility is high, investors are more likely to take risk off their portfolios and demand higher returns for taking on higher risk. This can push down equity and bond prices. On the other hand, if the economic outlook is positive, investors may be willing to take on more risk, in turn potentially boosting equity prices.
Current Investment Returns in Context
Today, financial markets are seeing sharp swings as the ripple effects of higher interest rates are sinking in. For investors, historical data provides insight on long-term asset allocation trends. Over the last century, cycles of high interest rates have come and gone. Both equity and bond investment returns have been resilient for investors who stay the course.