Since the pandemic began, there have been innumerable tracking resources made available online, but rarely do they paint a complete picture of a country’s containment progress.
How Much Progress Is Really Being Made
Featured above, this continuously updated chart from Our World in Data provides a more complete look at the efficacy of COVID-19 containment strategies, sorted by country. It is a variation of the Epidemic Curve (or “epi curve”), showing confirmed COVID-19 cases per country in relation to their testing rates—what’s revealed is the strength of each country’s containment strategy. — Our World in Data
Why Look at it This Way? Adequate Benchmarking
Countries vary widely in how they monitor and report on COVID-19. Cases in this particular chart were confirmed via laboratory testing, and the data covers 66% of the globe’s population. Depending on a country’s containment efforts, confirmed cases can differ dramatically from total cases. To get a better idea of that difference, Our World in Data looked closer at the extent of testing. As they report, the World Health Organization considers an adequate benchmark to be 10-30 tests per confirmed case. And for those countries that experience larger outbreaks, there must be more tests conducted per confirmed case.
What the COVID Test-to-Case Ratio Tells Us
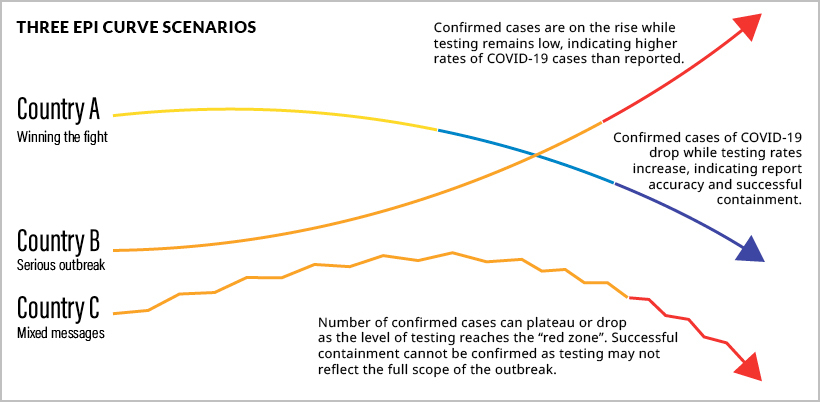
Line Trajectory: In this chart, rising lines show that the average number of laboratory-confirmed cases has increased over time, and vice versa for falling lines. Beyond flattening the curve, the end game is to have all of those lines reach zero. Blue Lines: The darker the blue line, the more likely that the line is an accurate indicator, as thousands of tests have been administered per confirmed case. The more blue lines this chart shows over time, the better for us all. Red Lines: By contrast, the warmer the color of the line, the fewer tests are being administered per confirmed case, and it is less likely to be an accurate measure of COVID-19 cases. Red lines, for example, indicate that only five tests are conducted for every confirmed case, suggesting that the count is not accurate and that many cases are going unreported.
Consider these three scenarios in the diagram above, and hover over countries in the main visualization to compare:
Country A: Winning the fight against COVID-19. These countries, like New Zealand, have steadily increased the number of tests per confirmed case. Country A administers hundreds or thousands of tests per confirmed case. The likelihood of missed cases is far lower, most cases are accounted for, and they can confidently state they are winning the fight against COVID-19. Country B: A severe, prolonged outbreak. In comparison, countries like the U.S. have experienced a steady rise in confirmed cases. They also have lower rates of testing—only five tests per confirmed case. Country B cases are likely to be higher than the number reported, a fact that is especially concerning given that the U.S. has already surpassed the rest of the world’s countries in confirmed cases. Country C: A volatile scenario. While confirmed cases decrease, there is much room for doubt. In Country C (South Africa for instance), confirmed cases are decreasing, but very few tests are administered. Unfortunately, this indicates there are many unrepresented cases. Country C probably has a larger problem than its downward trajectory would indicate.
Cases Per Million People
From a different angle, we can see daily new COVID-19 cases per capita. This gives us a better sense of how countries compare in terms of confirmed cases.
Countries like Thailand, New Zealand, and South Korea all show relatively low rates of COVID-19 per capita, as well as high levels of testing. Conversely, countries like Spain and Kuwait reveal high levels of confirmed cases per capita and extremely low testing rates.
Another Perspective for Good Measure
For a holistic view of testing, the map below shows us the daily number of tests for each newly confirmed COVID-19 case, based on a rolling 7-day average. Countries like Norway, Australia, and Canada reveal strong testing-to-confirmed-case ratios. In contrast, countries like Bolivia and the Philippines reveal the probability of out-of-control outbreaks.
Due to lower levels of testing in relation to confirmed cases, countries in red are more likely to leave cases unreported.
Making Sense of the Unknown
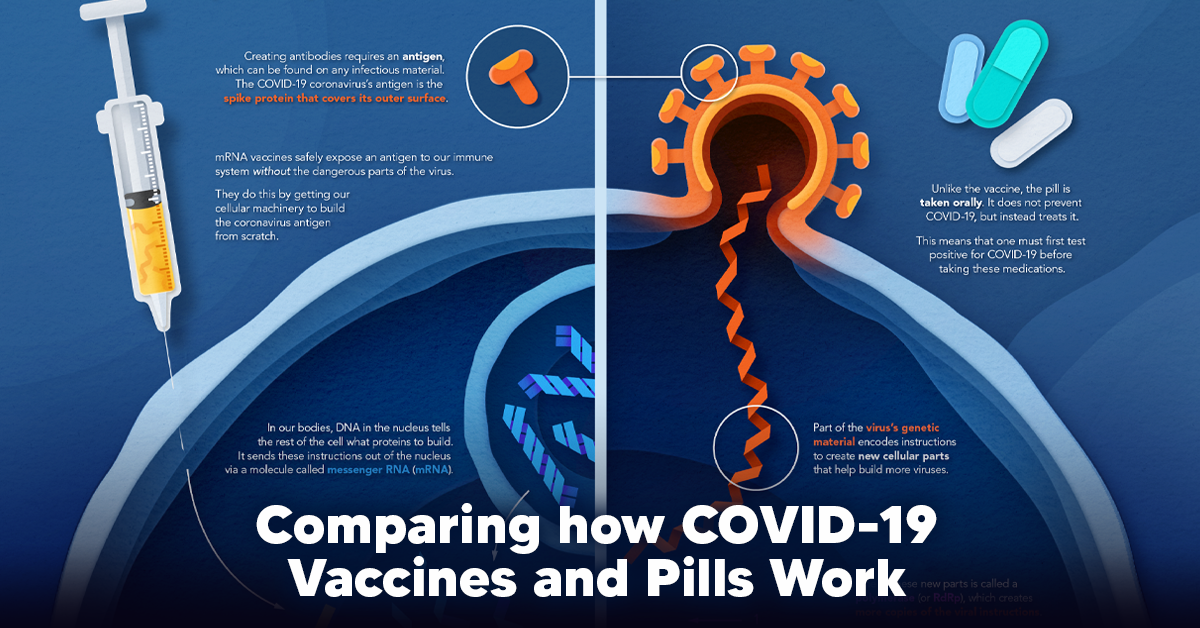
Although charts like these allow us to look at relationships between critical variables, there are no guarantees of what will come of this outbreak or any second waves. The only certainty right now, is uncertainty. But with visualizations like this one—updated daily—we can at least stay up-to-speed with the knowledge curve. on The leading options for preventing infection include social distancing, mask-wearing, and vaccination. They are still recommended during the upsurge of the coronavirus’s latest mutation, the Omicron variant. But in December 2021, The United States Food and Drug Administration (USDA) granted Emergency Use Authorization to two experimental pills for the treatment of new COVID-19 cases. These medications, one made by Pfizer and the other by Merck & Co., hope to contribute to the fight against the coronavirus and its variants. Alongside vaccinations, they may help to curb extreme cases of COVID-19 by reducing the need for hospitalization. Despite tackling the same disease, vaccines and pills work differently:
How a Vaccine Helps Prevent COVID-19
The main purpose of a vaccine is to prewarn the body of a potential COVID-19 infection by creating antibodies that target and destroy the coronavirus. In order to do this, the immune system needs an antigen. It’s difficult to do this risk-free since all antigens exist directly on a virus. Luckily, vaccines safely expose antigens to our immune systems without the dangerous parts of the virus. In the case of COVID-19, the coronavirus’s antigen is the spike protein that covers its outer surface. Vaccines inject antigen-building instructions* and use our own cellular machinery to build the coronavirus antigen from scratch. When exposed to the spike protein, the immune system begins to assemble antigen-specific antibodies. These antibodies wait for the opportunity to attack the real spike protein when a coronavirus enters the body. Since antibodies decrease over time, booster immunizations help to maintain a strong line of defense. *While different vaccine technologies exist, they all do a similar thing: introduce an antigen and build a stronger immune system.
How COVID Antiviral Pills Work
Antiviral pills, unlike vaccines, are not a preventative strategy. Instead, they treat an infected individual experiencing symptoms from the virus. Two drugs are now entering the market. Merck & Co.’s Lagevrio®, composed of one molecule, and Pfizer’s Paxlovid®, composed of two. These medications disrupt specific processes in the viral assembly line to choke the virus’s ability to replicate.
The Mechanism of Molnupiravir
RNA-dependent RNA Polymerase (RdRp) is a cellular component that works similar to a photocopying machine for the virus’s genetic instructions. An infected host cell is forced to produce RdRp, which starts generating more copies of the virus’s RNA. Molnupiravir, developed by Merck & Co., is a polymerase inhibitor. It inserts itself into the viral instructions that RdRp is copying, jumbling the contents. The RdRp then produces junk.
The Mechanism of Nirmatrelvir + Ritonavir
A replicating virus makes proteins necessary for its survival in a large, clumped mass called a polyprotein. A cellular component called a protease cuts a virus’s polyprotein into smaller, workable pieces. Pfizer’s antiviral medication is a protease inhibitor made of two pills: With a faulty polymerase or a large, unusable polyprotein, antiviral medications make it difficult for the coronavirus to replicate. If treated early enough, they can lessen the virus’s impact on the body.
The Future of COVID Antiviral Pills and Medications
Antiviral medications seem to have a bright future ahead of them. COVID-19 antivirals are based on early research done on coronaviruses from the 2002-04 SARS-CoV and the 2012 MERS-CoV outbreaks. Current breakthroughs in this technology may pave the way for better pharmaceuticals in the future. One half of Pfizer’s medication, ritonavir, currently treats many other viruses including HIV/AIDS. Gilead Science is currently developing oral derivatives of remdesivir, another polymerase inhibitor currently only offered to inpatients in the United States. More coronavirus antivirals are currently in the pipeline, offering a glimpse of control on the looming presence of COVID-19. Author’s Note: The medical information in this article is an information resource only, and is not to be used or relied on for any diagnostic or treatment purposes. Please talk to your doctor before undergoing any treatment for COVID-19. If you become sick and believe you may have symptoms of COVID-19, please follow the CDC guidelines.