Without the luxury of a crystal ball, investors must find opportunities by analyzing the market. There’s just one problem: the 24/7 news cycle is enough to make anyone’s head spin. Where should an investor focus their attention, when almost every new venture is forecast to be the next big thing?
The Powerful Influence of Macro Trends
Today’s infographic comes to us from U.S. Global Investors, and it highlights how analyzing macro trends can serve as a key investment tool.
Two Main Investment Approaches
When selecting stocks, many investors fall into one of two camps:
1. Top-down Investing
Considering the aging Chinese population, a top-down investor may choose to invest in Chinese healthcare stocks.
2. Bottom-up Investing
A bottom-up investor could analyze Home Depot and choose to invest if it had strong performance relative to Lowe’s. These approaches can be used separately, or even combined together. Zooming out allows investors to identify the big picture opportunities. Then, a bottom-up approach can find the companies that best capitalize on each trend.
What is a Macro Trend?
A macro trend is a long-term directional shift that affects a large population, often on a global scale. For example, climate change is affecting industries in both positive and negative ways. While “green” industries have seen increased support, ski resorts are projected to have 50% shorter winter seasons by 2050. There are a couple of main ways to identify macro trends:
Discovering Long-Term Value
Macro trends are a key tool for discovering long-term market opportunities. They are beneficial because they are:
Unbiased and data-driven Not swayed by daily headlines Tend to avoid riskier, niche industries Can be diversified by sectors and regions
There are currently many macro trends at play. For example, Trump’s sweeping tax reform and deregulation boosted the U.S. economy, lifting GDP growth to a 13-year high of over 3% in 2018 Q3. However, not everyone’s a winner. America’s reduced taxes have made Canada less competitive. It’s estimated that 4.9% of Canada’s GDP is at risk due to ripple effects from U.S. tax reform. What’s more, regulators worry that the bank deregulations might put the financial system at risk. — Lael Brainard, Member of the Board of Governors of the Federal Reserve So, how do investors distill this wealth of information into a future of wealth?
Spotting the Next Wave
In today’s hyper-connected world, it’s easy to get lost in data overload. Thinking big picture allows investors to focus on trends that:
Have a long-term outlook Affect a large population Create a clearer vision of the future
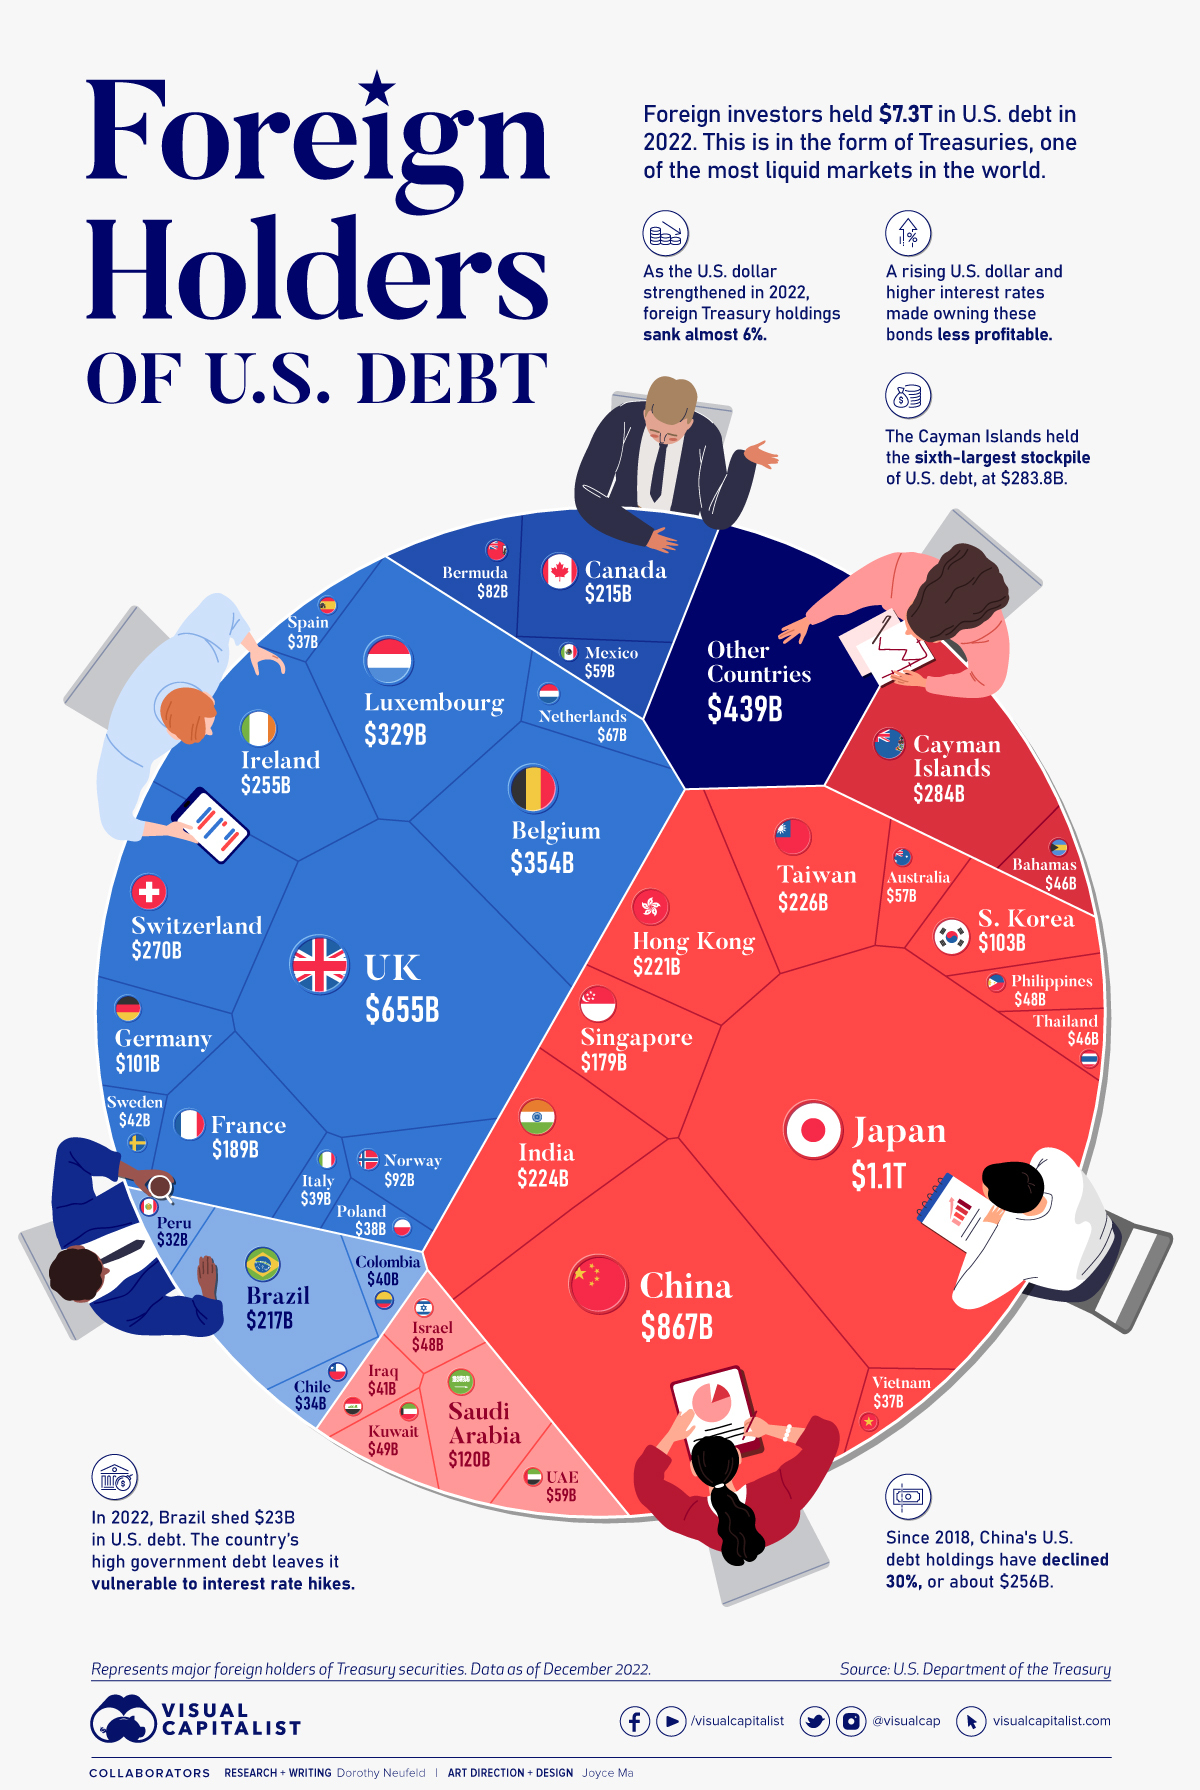
Then, an investor can target the most promising regions and sectors. When used effectively, this approach enables investors to ride the next big wave that will shape markets. on These are in the form of Treasury securities, some of the most liquid assets worldwide. Central banks use them for foreign exchange reserves and private investors flock to them during flights to safety thanks to their perceived low default risk. Beyond these reasons, foreign investors may buy Treasuries as a store of value. They are often used as collateral during certain international trade transactions, or countries can use them to help manage exchange rate policy. For example, countries may buy Treasuries to protect their currency’s exchange rate from speculation. In the above graphic, we show the foreign holders of the U.S. national debt using data from the U.S. Department of the Treasury.
Top Foreign Holders of U.S. Debt
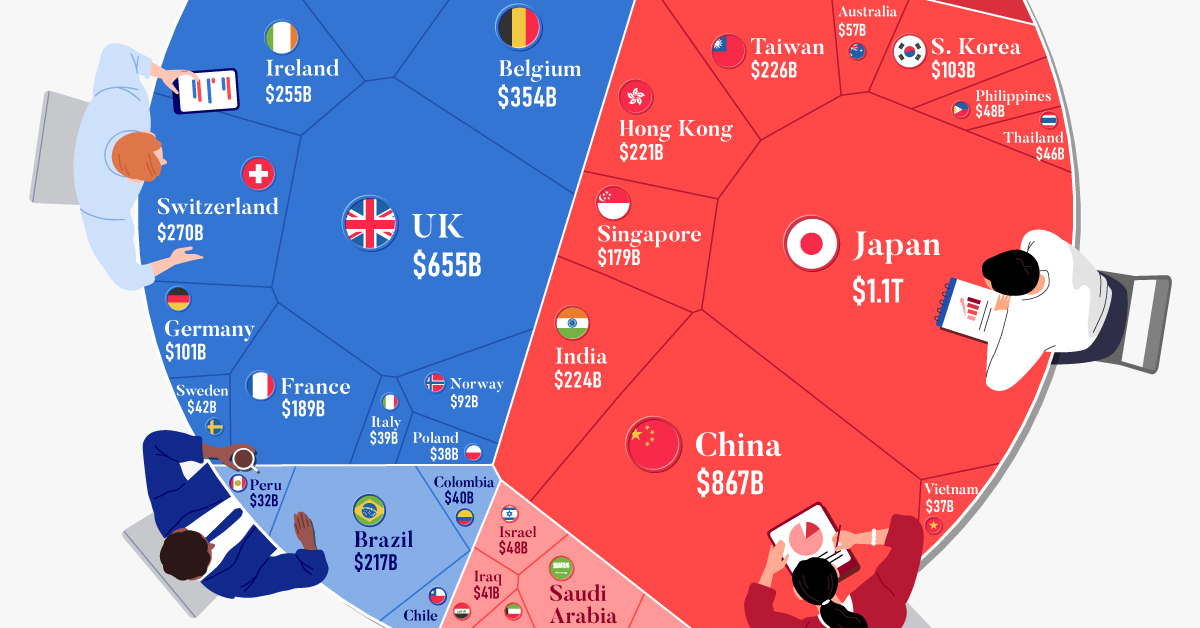
With $1.1 trillion in Treasury holdings, Japan is the largest foreign holder of U.S. debt. Japan surpassed China as the top holder in 2019 as China shed over $250 billion, or 30% of its holdings in four years. This bond offloading by China is the one way the country can manage the yuan’s exchange rate. This is because if it sells dollars, it can buy the yuan when the currency falls. At the same time, China doesn’t solely use the dollar to manage its currency—it now uses a basket of currencies. Here are the countries that hold the most U.S. debt: As the above table shows, the United Kingdom is the third highest holder, at over $655 billion in Treasuries. Across Europe, 13 countries are notable holders of these securities, the highest in any region, followed by Asia-Pacific at 11 different holders. A handful of small nations own a surprising amount of U.S. debt. With a population of 70,000, the Cayman Islands own a towering amount of Treasury bonds to the tune of $284 billion. There are more hedge funds domiciled in the Cayman Islands per capita than any other nation worldwide. In fact, the four smallest nations in the visualization above—Cayman Islands, Bermuda, Bahamas, and Luxembourg—have a combined population of just 1.2 million people, but own a staggering $741 billion in Treasuries.
Interest Rates and Treasury Market Dynamics
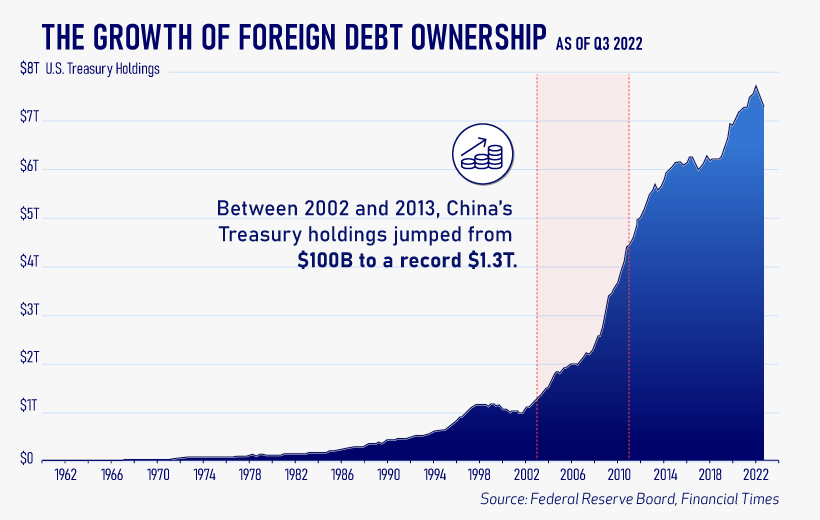
Over 2022, foreign demand for Treasuries sank 6% as higher interest rates and a strong U.S. dollar made owning these bonds less profitable. This is because rising interest rates on U.S. debt makes the present value of their future income payments lower. Meanwhile, their prices also fall. As the chart below shows, this drop in demand is a sharp reversal from 2018-2020, when demand jumped as interest rates hovered at historic lows. A similar trend took place in the decade after the 2008-09 financial crisis when U.S. debt holdings effectively tripled from $2 to $6 trillion.
Driving this trend was China’s rapid purchase of Treasuries, which ballooned from $100 billion in 2002 to a peak of $1.3 trillion in 2013. As the country’s exports and output expanded, it sold yuan and bought dollars to help alleviate exchange rate pressure on its currency. Fast-forward to today, and global interest-rate uncertainty—which in turn can impact national currency valuations and therefore demand for Treasuries—continues to be a factor impacting the future direction of foreign U.S. debt holdings.

