By one definition, a complex system is any system that features a large number of interacting components (agents, processes, etc.) whose aggregate activity is nonlinear (not derivable from the summations of the activity of individual components) and typically exhibits hierarchical self-organization under selective pressures. In today’s infographic from Meraglim we use accumulating snow and an impending avalanche as an example of a complex system – but really, such systems can be found everywhere. Weather is another complex system, and ebb and flow of populations is another example.
Markets are Complex Systems
Just like in the avalanche example, where various factors at the top of a mountain (accumulating volumes of snow, weather, temperature, geology, gravity, etc.) make up a complex system that is difficult to predict, markets are similarly complex. In fact, markets meet all the properties of complex systems, as outlined by scientists:
- Diverse System actors have different points of view. (i.e. bullish, bearish, long, short, leveraged, non-leveraged, etc.)
- Connected Capital markets are over-connected, and information spreads fast. (i.e. chat rooms, phone calls, emails, Thomson Reuters, Dow Jones, Bloomberg, trading systems, order entry systems, etc.)
- Interaction Trillions of dollars of securities are exchanged in transactions every day (i.e. stocks, bonds, currencies, derivatives, etc.)
- Adaptive Behavior Actors change their behavior based on the signals they are getting (i.e. making or losing money, etc.) And like the avalanche example, where a single snowflake can trigger a much bigger event, there are increasing signs that the complexity behind the stock market has also reached a critical state.
Markets in a Critical State
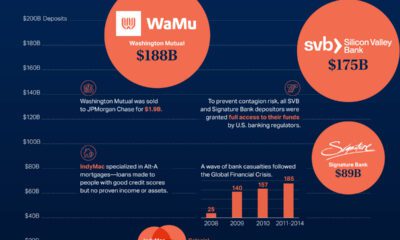
Here are just some examples that show how the market has entered into an increasingly critical state: Record-Low Volatility The VIX, an index that aims to measure the volatility of the market, hit all-time lows this summer. Bull Market Length Meanwhile, the current bull market (2009-present) is the second-longest bull market in modern history at 3,109 days. The only bull market that was longer went from the 1987 crash to the Dot-com bust. Valuations at Highs Stock valuations, based on Robert Schiller’s CAPE ratio (which looks at cyclically-adjusted price-to-earnings), are approaching all-time highs as well. Right now, it sits 83.3% higher than the historical mean of 16.8. It was only higher in 1929 and 2000, right before big crashes occurred. Market Goes Up Investor overconfidence leads investors to believe the market only goes up, and never goes down. Indeed, in this bull market, markets have gone up 67 of the months (an average gain of 3.3%), and have gone down only 34 months (average drop of -2.6%). Here are some additional signs of systemic risk that make complex markets less stable:
A densely connected network of bank obligations and liabilities Over $70 trillion in debt added since Financial Crisis Over $1 quadrillion in notional value of derivatives Non-bank shadow finance through hedge funds and securitization make risk impossible to measure Increased leverage of banks in some markets Greater concentration of financial assets in fewer companies
In other words, there are legitimate reasons to be concerned about “snow” accumulation – and any such “snowflake” could trigger the avalanche. – Jim Rickards, author of Road to Ruin
The Next Snowflake
What could trigger the next avalanche? It could be anything, including the failure of a major bank, a natural disaster, war, a cyber-financial attack, or any other significant event. Such “snowflakes” come around every few years: 1987: Black Monday The Dow fell 508 points (-22.6%) in one day. 1994-95: The Mexican peso crisis Systemic collapse narrowly avoided when the U.S. government bailed out Mexico using the controversial $20 billion “Exchange Stabilization Fund”. 1997: Asian financial crisis East Asian currencies fell in value by as much as -38%, and international stocks by as much as -60%. 1998: Long Term Capital Management Hedge fund LTCM was in extreme distress, and within hours of shutting down every market in the world. 2000: The Dotcom crash Nasdaq fell -78% in 30 months after early Dotcom companies crashed and burned. 2008: Lehman Brothers bankruptcy Morgan Stanley, Goldman Sachs, Bank of America, and J.P. Morgan were days away from same fate until government stepped in.
Shelter from the Avalanche
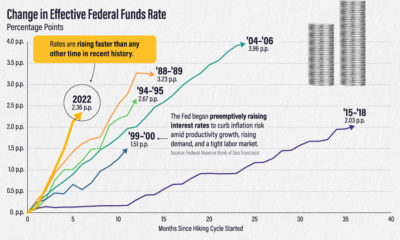
The Fed and mainstream economists use equilibrium theory, regressions, and correlations to quantify the markets. And while they pay lip-service to black swans, they don’t have a good way of forecasting them or predicting them. Markets are complex – and only complexity theory and predictive analytics can help to shed light on their next move. Alternatively, investors can seek shelter from the storm by investing in assets that cannot be digitally frozen (bank accounts, brokerage accounts, etc.) or have their value inflated away (cash, fixed-income). Such assets include land, precious metals, fine art, and private equity. on Last year, stock and bond returns tumbled after the Federal Reserve hiked interest rates at the fastest speed in 40 years. It was the first time in decades that both asset classes posted negative annual investment returns in tandem. Over four decades, this has happened 2.4% of the time across any 12-month rolling period. To look at how various stock and bond asset allocations have performed over history—and their broader correlations—the above graphic charts their best, worst, and average returns, using data from Vanguard.
How Has Asset Allocation Impacted Returns?
Based on data between 1926 and 2019, the table below looks at the spectrum of market returns of different asset allocations:
We can see that a portfolio made entirely of stocks returned 10.3% on average, the highest across all asset allocations. Of course, this came with wider return variance, hitting an annual low of -43% and a high of 54%.
A traditional 60/40 portfolio—which has lost its luster in recent years as low interest rates have led to lower bond returns—saw an average historical return of 8.8%. As interest rates have climbed in recent years, this may widen its appeal once again as bond returns may rise.
Meanwhile, a 100% bond portfolio averaged 5.3% in annual returns over the period. Bonds typically serve as a hedge against portfolio losses thanks to their typically negative historical correlation to stocks.
A Closer Look at Historical Correlations
To understand how 2022 was an outlier in terms of asset correlations we can look at the graphic below:
The last time stocks and bonds moved together in a negative direction was in 1969. At the time, inflation was accelerating and the Fed was hiking interest rates to cool rising costs. In fact, historically, when inflation surges, stocks and bonds have often moved in similar directions. Underscoring this divergence is real interest rate volatility. When real interest rates are a driving force in the market, as we have seen in the last year, it hurts both stock and bond returns. This is because higher interest rates can reduce the future cash flows of these investments. Adding another layer is the level of risk appetite among investors. When the economic outlook is uncertain and interest rate volatility is high, investors are more likely to take risk off their portfolios and demand higher returns for taking on higher risk. This can push down equity and bond prices. On the other hand, if the economic outlook is positive, investors may be willing to take on more risk, in turn potentially boosting equity prices.
Current Investment Returns in Context
Today, financial markets are seeing sharp swings as the ripple effects of higher interest rates are sinking in. For investors, historical data provides insight on long-term asset allocation trends. Over the last century, cycles of high interest rates have come and gone. Both equity and bond investment returns have been resilient for investors who stay the course.