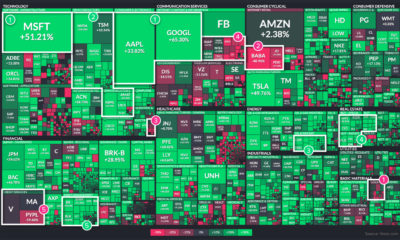
Today’s infographic comes to us from HowMuch.net and it visualizes data on S&P 500 companies to see if there is any relationship between CEO pay and stock performance.
For Richer or Poorer
To begin, let’s look at the highest and lowest paid CEOs on the S&P 500, and their associated performance levels. Data here comes from a report by the Wall Street Journal. Below are the five CEOs with the most pay in 2018: Last year, David Zaslav led top CEOs by taking home $129.4 million from Discovery, Inc., the parent company of various TV properties such as the Discovery Channel, Animal Planet, HGTV, Food Network, and other non-fiction focused programming. He delivered a 10.4% shareholder return, when the S&P 500 itself finished in negative territory in 2018. Of the mix of highest-paid CEOs, Bob Iger of Disney may be able to claim the biggest impact. He helped close a $71.3 billion acquisition of 21st Century Fox, while also leading Disney’s efforts to launch a streaming service to compete with Netflix. The market rewarded Disney with a 20.4% shareholder return, while Iger received a paycheck of $65.6 million. Now, let’s look at the lowest paid CEOs in 2018: On the list of lowest paid CEOs, we see two tech titans (Larry Page and Jack Dorsey) that have each opted for $1 salaries. Of course, they are both billionaires that own large amounts of shares in their respective companies, so they are not particularly worried about annual paychecks. Also appearing here is Warren Buffett, who is technically paid $100,000 per year by Berkshire Hathaway plus an amount of “other compensation” that fluctuates annually. While this is indeed a modest salary, the Warren Buffett Empire is anything but modest in size – and the legendary value investor currently holds a net worth of $84.3 billion. Finally, it’s worth noting that while J. Jayson Adair of Copart was one of the lowest paid CEOs at $203,000 in 2018, the company had the best return on the S&P 500 at 82.2%. Today, the company’s stock price still sits near all-time highs.
Maxing Returns
Finally, let’s take a peek at the CEOs that received the highest shareholder returns, and if they seem to correlate with compensation at all. Interestingly, three of highest performing CEOs – in terms of shareholder returns – actually took home smaller amounts than the median S&P 500 annual paycheck of $12.4 million. This includes the aforementioned A. Jayson Adair, who raked in only $203,000 in 2018. That said, there is a good counterpoint to this as well. Of the five CEOs who had the worst returns, four of them made less than the median value of $12.4 million, while one remaining CEO took home slightly more. In other words, both the best and worst performing CEOs skew towards lower-than-average pay to some degree. on Last year, stock and bond returns tumbled after the Federal Reserve hiked interest rates at the fastest speed in 40 years. It was the first time in decades that both asset classes posted negative annual investment returns in tandem. Over four decades, this has happened 2.4% of the time across any 12-month rolling period. To look at how various stock and bond asset allocations have performed over history—and their broader correlations—the above graphic charts their best, worst, and average returns, using data from Vanguard.
How Has Asset Allocation Impacted Returns?
Based on data between 1926 and 2019, the table below looks at the spectrum of market returns of different asset allocations:
We can see that a portfolio made entirely of stocks returned 10.3% on average, the highest across all asset allocations. Of course, this came with wider return variance, hitting an annual low of -43% and a high of 54%.
A traditional 60/40 portfolio—which has lost its luster in recent years as low interest rates have led to lower bond returns—saw an average historical return of 8.8%. As interest rates have climbed in recent years, this may widen its appeal once again as bond returns may rise.
Meanwhile, a 100% bond portfolio averaged 5.3% in annual returns over the period. Bonds typically serve as a hedge against portfolio losses thanks to their typically negative historical correlation to stocks.
A Closer Look at Historical Correlations
To understand how 2022 was an outlier in terms of asset correlations we can look at the graphic below:
The last time stocks and bonds moved together in a negative direction was in 1969. At the time, inflation was accelerating and the Fed was hiking interest rates to cool rising costs. In fact, historically, when inflation surges, stocks and bonds have often moved in similar directions. Underscoring this divergence is real interest rate volatility. When real interest rates are a driving force in the market, as we have seen in the last year, it hurts both stock and bond returns. This is because higher interest rates can reduce the future cash flows of these investments. Adding another layer is the level of risk appetite among investors. When the economic outlook is uncertain and interest rate volatility is high, investors are more likely to take risk off their portfolios and demand higher returns for taking on higher risk. This can push down equity and bond prices. On the other hand, if the economic outlook is positive, investors may be willing to take on more risk, in turn potentially boosting equity prices.
Current Investment Returns in Context
Today, financial markets are seeing sharp swings as the ripple effects of higher interest rates are sinking in. For investors, historical data provides insight on long-term asset allocation trends. Over the last century, cycles of high interest rates have come and gone. Both equity and bond investment returns have been resilient for investors who stay the course.