In certain years, all commodities will move in price together in an obvious and correlated fashion. This is a representation of the cyclical characteristics of commodity markets, in which macroeconomic factors align to create a tide that lifts or sinks all boats. At the same time, however, each individual commodity is incredibly unique with its own specific set of supply and demand circumstances. In the years when these supply or demand crunches materialize, a certain commodity can surge or crash in price, separating itself from the rest of the pack.
A Decade of Commodity Returns
Today’s visualization comes to us from our friends at U.S. Global Investors, and it tracks commodity returns over the last decade. More specifically, it takes a closer look at individual commodities (i.e. corn, gold, oil, zinc) to show how performance can vary over time. With a quick examination of the graphic, you can see years where commodities moved together – and some years where individual commodities stole the show unexpectedly.
Palladium: A Perennial Winner
The best performing commodity in 2018 was palladium, which found itself up 18.6% – just enough to edge out corn, which jumped up 17.9% in price last year. Interestingly, palladium has also been the best performing commodity over the 10-year period as well:
Palladium has finished in first place in four of the last 10 years, including in 2017 and 2018 – it’s also impressive to note that palladium has only had negative returns twice in the last decade (2011, 2015).
A Crude Awakening
The worst performing commodity in 2018 was crude oil, which fell -24.8% in price. Like palladium, this wasn’t a unique occurrence: crude has actually been the worst performing commodity investment over the last decade:
As you can see, crude oil has been the worst (or second worst) commodity in three of the last five years. Further, as our chart on how all assets performed in 2018 shows, crude oil was outperformed by every other asset class, and the energy sector had the poorest performance out of all S&P 500 sectors last year. on
#1: High Reliability
Nuclear power plants run 24/7 and are the most reliable source of sustainable energy. Nuclear electricity generation remains steady around the clock throughout the day, week, and year. Meanwhile, daily solar generation peaks in the afternoon when electricity demand is usually lower, and wind generation depends on wind speeds.As the use of variable solar and wind power increases globally, nuclear offers a stable and reliable backbone for a clean electricity grid.
#2: Clean Electricity
Nuclear reactors use fission to generate electricity without any greenhouse gas (GHG) emissions.Consequently, nuclear power is the cleanest energy source on a lifecycle basis, measured in CO2-equivalent emissions per gigawatt-hour (GWh) of electricity produced by a power plant over its lifetime. The lifecycle emissions from a typical nuclear power plant are 273 times lower than coal and 163 times lower than natural gas. Furthermore, nuclear is relatively less resource-intensive, allowing for lower supply chain emissions than wind and solar plants.
#3: Stable Affordability
Although nuclear plants can be expensive to build, they are cost-competitive in the long run. Most nuclear plants have an initial lifetime of around 40 years, after which they can continue operating with approved lifetime extensions. Nuclear plants with lifetime extensions are the cheapest sources of electricity in the United States, and 88 of the country’s 92 reactors have received approvals for 20-year extensions. Additionally, according to the World Nuclear Association, nuclear plants are relatively less susceptible to fuel price volatility than natural gas plants, allowing for stable costs of electricity generation.
#4: Energy Efficiency
Nuclear’s high energy return on investment (EROI) exemplifies its exceptional efficiency. EROI measures how many units of energy are returned for every unit invested in building and running a power plant, over its lifetime. According to a 2018 study by Weissbach et al., nuclear’s EROI is 75 units, making it the most efficient energy source by some distance, with hydropower ranking second at 35 units.
#5: Sustainable Innovation
New, advanced reactor designs are bypassing many of the difficulties faced by traditional nuclear plants, making nuclear power more accessible.
Small Modular Reactors (SMRs) are much smaller than conventional reactors and are modular—meaning that their components can be transported and assembled in different locations. Microreactors are smaller than SMRs and are designed to provide electricity in remote and small market areas. They can also serve as backup power sources during emergencies.
These reactor designs offer several advantages, including lower initial capital costs, portability, and increased scalability.
A Nuclear-Powered Future
Nuclear power is making a remarkable comeback as countries work to achieve climate goals and ultimately, a state of energy utopia. Besides the 423 reactors in operation worldwide, another 56 reactors are under construction, and at least 69 more are planned for construction. Some nations, like Japan, have also reversed their attitudes toward nuclear power, embracing it as a clean and reliable energy source for the future. CanAlaska is a leading exploration company in the Athabasca Basin, the Earth’s richest uranium depository. Click here to learn more now. In part 3 of the Road to Energy Utopia series, we explore the unique properties of uranium, the fuel that powers nuclear reactors.


title: “Infographic The Periodic Table Of Commodity Returns 2019 Edition " ShowToc: true date: “2023-02-01” author: “Barbara Imlay”
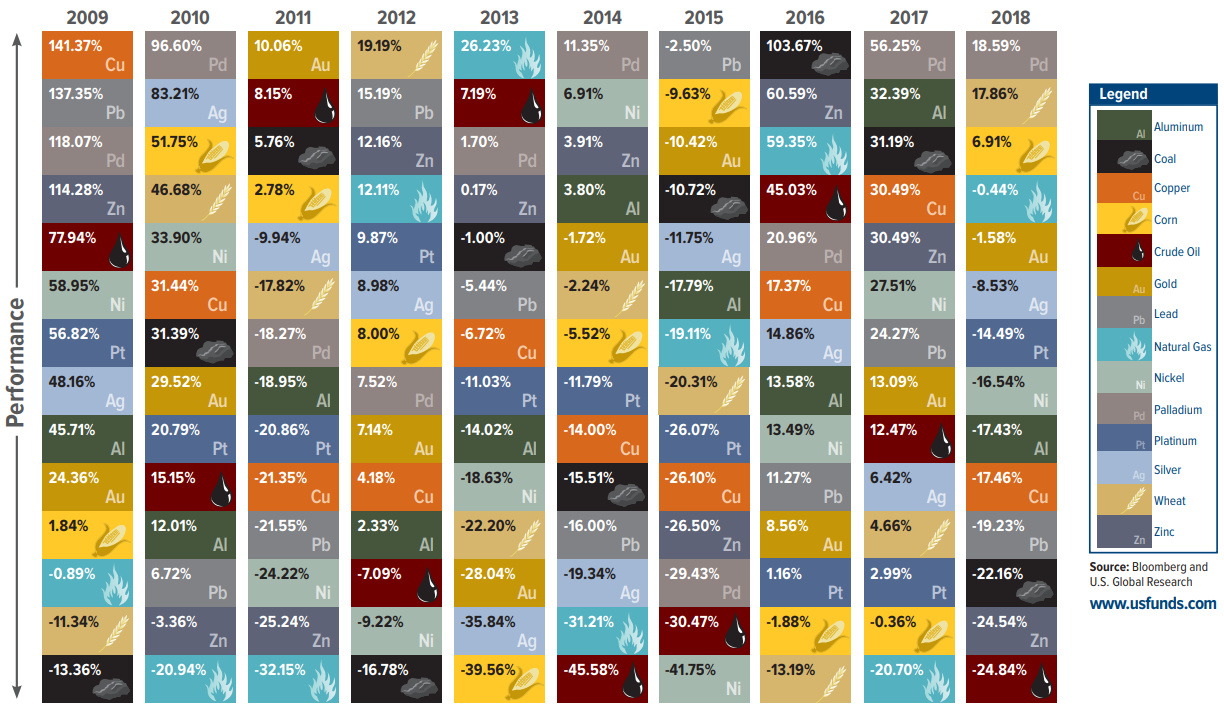
Periodic Table of Commodity Returns (2019 Edition)
Commodities are an interesting asset class to watch. In certain years, all commodities will move in price together in an obvious and correlated fashion. This is a representation of the cyclical characteristics of commodity markets, in which macroeconomic factors align to create a tide that lifts or sinks all boats. At the same time, however, each individual commodity is incredibly unique with its own specific set of supply and demand circumstances. In the years when these supply or demand crunches materialize, a certain commodity can surge or crash in price, separating itself from the rest of the pack.
A Decade of Commodity Returns
Today’s visualization comes to us from our friends at U.S. Global Investors, and it tracks commodity returns over the last decade. More specifically, it takes a closer look at individual commodities (i.e. corn, gold, oil, zinc) to show how performance can vary over time. With a quick examination of the graphic, you can see years where commodities moved together – and some years where individual commodities stole the show unexpectedly.
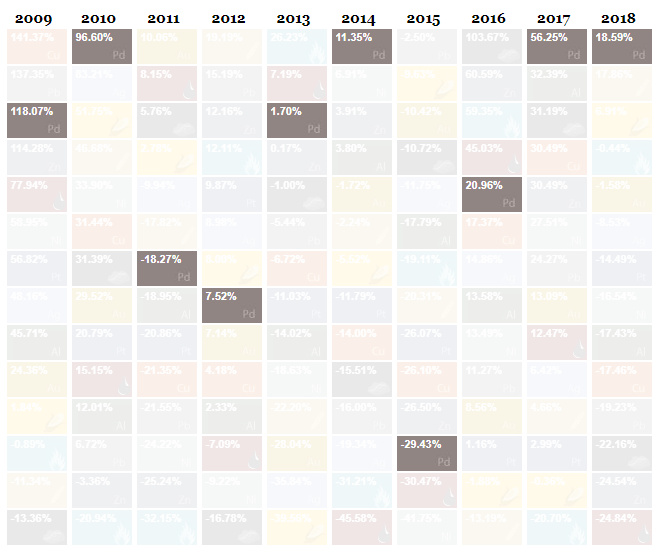
Palladium: A Perennial Winner
The best performing commodity in 2018 was palladium, which found itself up 18.6% – just enough to edge out corn, which jumped up 17.9% in price last year. Interestingly, palladium has also been the best performing commodity over the 10-year period as well:
Palladium has finished in first place in four of the last 10 years, including in 2017 and 2018 – it’s also impressive to note that palladium has only had negative returns twice in the last decade (2011, 2015).
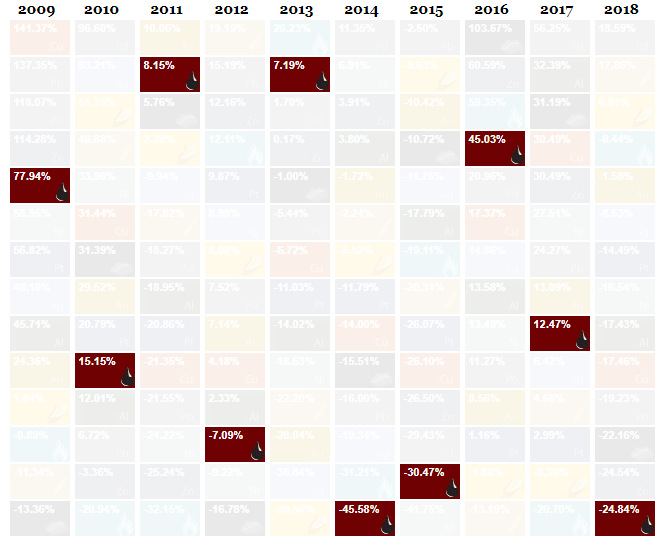
A Crude Awakening
The worst performing commodity in 2018 was crude oil, which fell -24.8% in price. Like palladium, this wasn’t a unique occurrence: crude has actually been the worst performing commodity investment over the last decade:
As you can see, crude oil has been the worst (or second worst) commodity in three of the last five years. Further, as our chart on how all assets performed in 2018 shows, crude oil was outperformed by every other asset class, and the energy sector had the poorest performance out of all S&P 500 sectors last year.
on
#1: High Reliability
Nuclear power plants run 24/7 and are the most reliable source of sustainable energy. Nuclear electricity generation remains steady around the clock throughout the day, week, and year. Meanwhile, daily solar generation peaks in the afternoon when electricity demand is usually lower, and wind generation depends on wind speeds.As the use of variable solar and wind power increases globally, nuclear offers a stable and reliable backbone for a clean electricity grid.
#2: Clean Electricity
Nuclear reactors use fission to generate electricity without any greenhouse gas (GHG) emissions.Consequently, nuclear power is the cleanest energy source on a lifecycle basis, measured in CO2-equivalent emissions per gigawatt-hour (GWh) of electricity produced by a power plant over its lifetime. The lifecycle emissions from a typical nuclear power plant are 273 times lower than coal and 163 times lower than natural gas. Furthermore, nuclear is relatively less resource-intensive, allowing for lower supply chain emissions than wind and solar plants.
#3: Stable Affordability
Although nuclear plants can be expensive to build, they are cost-competitive in the long run. Most nuclear plants have an initial lifetime of around 40 years, after which they can continue operating with approved lifetime extensions. Nuclear plants with lifetime extensions are the cheapest sources of electricity in the United States, and 88 of the country’s 92 reactors have received approvals for 20-year extensions. Additionally, according to the World Nuclear Association, nuclear plants are relatively less susceptible to fuel price volatility than natural gas plants, allowing for stable costs of electricity generation.
#4: Energy Efficiency
Nuclear’s high energy return on investment (EROI) exemplifies its exceptional efficiency. EROI measures how many units of energy are returned for every unit invested in building and running a power plant, over its lifetime. According to a 2018 study by Weissbach et al., nuclear’s EROI is 75 units, making it the most efficient energy source by some distance, with hydropower ranking second at 35 units.
#5: Sustainable Innovation
New, advanced reactor designs are bypassing many of the difficulties faced by traditional nuclear plants, making nuclear power more accessible.
Small Modular Reactors (SMRs) are much smaller than conventional reactors and are modular—meaning that their components can be transported and assembled in different locations. Microreactors are smaller than SMRs and are designed to provide electricity in remote and small market areas. They can also serve as backup power sources during emergencies.
These reactor designs offer several advantages, including lower initial capital costs, portability, and increased scalability.
A Nuclear-Powered Future
Nuclear power is making a remarkable comeback as countries work to achieve climate goals and ultimately, a state of energy utopia. Besides the 423 reactors in operation worldwide, another 56 reactors are under construction, and at least 69 more are planned for construction. Some nations, like Japan, have also reversed their attitudes toward nuclear power, embracing it as a clean and reliable energy source for the future. CanAlaska is a leading exploration company in the Athabasca Basin, the Earth’s richest uranium depository. Click here to learn more now. In part 3 of the Road to Energy Utopia series, we explore the unique properties of uranium, the fuel that powers nuclear reactors.