Before speculative bubbles could form around Dotcom companies (late-1990s) or housing prices (mid-2000s), some of the first financial bubbles formed from the prospect of trading with faraway lands. Looking back, it’s pretty easy to see why. Companies like the Dutch East India Company (known in Dutch as the VOC, or Verenigde Oost-Indische Compagnie) were granted monopolies on trade, and they engaged in daring voyages to mysterious and foreign places. They could acquire exotic goods, establish colonies, create military forces, and even initiate wars or conflicts around the world. Of course, the very nature of these risky ventures made getting any accurate indication of intrinsic value nearly impossible, which meant there were no real benchmarks for what companies like this should be worth.
Speculative Peak
The Dutch East India Company was established as a charter company in 1602, when it was granted a 21-year monopoly by the Dutch government for the spice trade in Asia. The company would eventually send over one million voyagers to Asia, which is more than the rest of Europe combined. However, despite its 200-year run as Europe’s foremost trading juggernaut – the speculative peak of the company’s prospects coincided with Tulip Mania in Holland in 1637. Widely considered the world’s first financial bubble, the history of Tulip Mania is a fantastic story in itself. During this frothy time, the Dutch East India Company was worth 78 million Dutch guilders, which translates to a whopping $7.9 trillion in modern dollars. This is according to sources such as Alex Planes from The Motley Fool, who has conducted extensive research on the history of very large companies in history.
Modern Comparisons
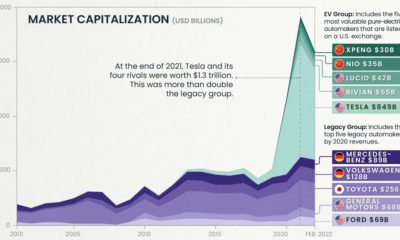
The peak value of the Dutch East India Company was so high, that it puts modern economies to shame. In fact, at its height, the Dutch East India Company was worth roughly the same amount as the GDPs of modern-day Japan ($4.8T) and Germany ($3.4T) added together. At the same time, the world’s most valuable company (Apple) only makes it to 11% of the peak value of the Dutch East India Company by itself.
Historic Heavyweights
Despite the speculation that fueled the run-up of Dutch East India Company shares, the company was still successful in real terms. At one point, it even had 70,000 employees – a massive accomplishment for a company born over 400 years ago. The same thing can’t be said for the other two most valuable companies in history – both of which were the subject of simultaneous bubbles occurring in France and Britain that popped in 1720. In France, the wealth of Louisiana was exaggerated in a marketing scheme for the newly formed Mississippi Company, and its value temporarily soared to the equivalent of $6.5 trillion today. Meanwhile, a joint-stock company in Britain, known as the South Sea Company, was granted a monopoly to trade with South America. It was eventually worth $4.3 trillion in modern currency. Interestingly, both would barely engage in any actual trade with the Americas. The other historic heavyweights included in our chart?
Saudi Aramco, at $4.1 trillion, based on calculations by University of Texas finance professor Sheridan Titman in 2010, and adjusted for inflation. PetroChina surpassed $1 trillion in market cap in 2007. Adjusted for inflation that’s $1.4 trillion today. Standard Oil, before its famous breakup due to monopolistic reasons, was worth at least $1 trillion. Adjusted for inflation it would likely be more, but we kept this conservative. Microsoft reached its peak valuation in 1999, at the top of the Dotcom Bubble. Today, that would be equal to $912 billion.
on Last year, stock and bond returns tumbled after the Federal Reserve hiked interest rates at the fastest speed in 40 years. It was the first time in decades that both asset classes posted negative annual investment returns in tandem. Over four decades, this has happened 2.4% of the time across any 12-month rolling period. To look at how various stock and bond asset allocations have performed over history—and their broader correlations—the above graphic charts their best, worst, and average returns, using data from Vanguard.
How Has Asset Allocation Impacted Returns?
Based on data between 1926 and 2019, the table below looks at the spectrum of market returns of different asset allocations:
We can see that a portfolio made entirely of stocks returned 10.3% on average, the highest across all asset allocations. Of course, this came with wider return variance, hitting an annual low of -43% and a high of 54%.
A traditional 60/40 portfolio—which has lost its luster in recent years as low interest rates have led to lower bond returns—saw an average historical return of 8.8%. As interest rates have climbed in recent years, this may widen its appeal once again as bond returns may rise.
Meanwhile, a 100% bond portfolio averaged 5.3% in annual returns over the period. Bonds typically serve as a hedge against portfolio losses thanks to their typically negative historical correlation to stocks.
A Closer Look at Historical Correlations
To understand how 2022 was an outlier in terms of asset correlations we can look at the graphic below:
The last time stocks and bonds moved together in a negative direction was in 1969. At the time, inflation was accelerating and the Fed was hiking interest rates to cool rising costs. In fact, historically, when inflation surges, stocks and bonds have often moved in similar directions. Underscoring this divergence is real interest rate volatility. When real interest rates are a driving force in the market, as we have seen in the last year, it hurts both stock and bond returns. This is because higher interest rates can reduce the future cash flows of these investments. Adding another layer is the level of risk appetite among investors. When the economic outlook is uncertain and interest rate volatility is high, investors are more likely to take risk off their portfolios and demand higher returns for taking on higher risk. This can push down equity and bond prices. On the other hand, if the economic outlook is positive, investors may be willing to take on more risk, in turn potentially boosting equity prices.
Current Investment Returns in Context
Today, financial markets are seeing sharp swings as the ripple effects of higher interest rates are sinking in. For investors, historical data provides insight on long-term asset allocation trends. Over the last century, cycles of high interest rates have come and gone. Both equity and bond investment returns have been resilient for investors who stay the course.