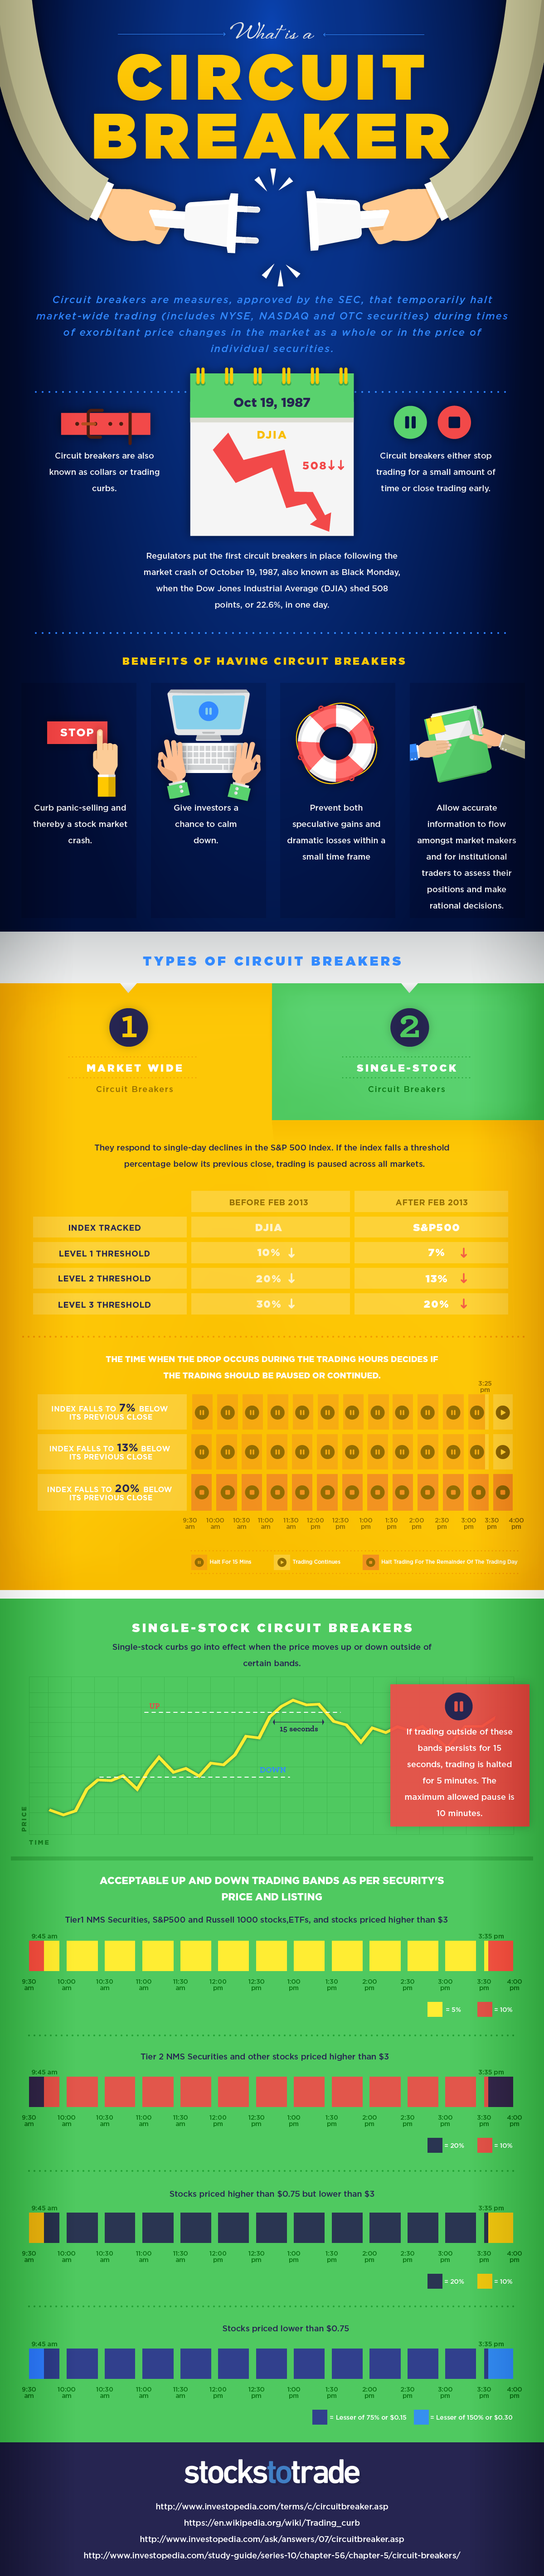
Today’s infographic comes to us from StocksToTrade.com, and it explains what happens when a large enough drop in the market triggers a “circuit breaker”, or a temporary halt in trading.
These temporary halts in trading, or “circuit breakers”, are measures approved by the SEC to calm down markets in the event of extreme volatility. The rules apply to NYSE, Nasdaq, and OTC markets, and were put in place following the events of Black Monday in 1987.
Circuit Breaker Rules
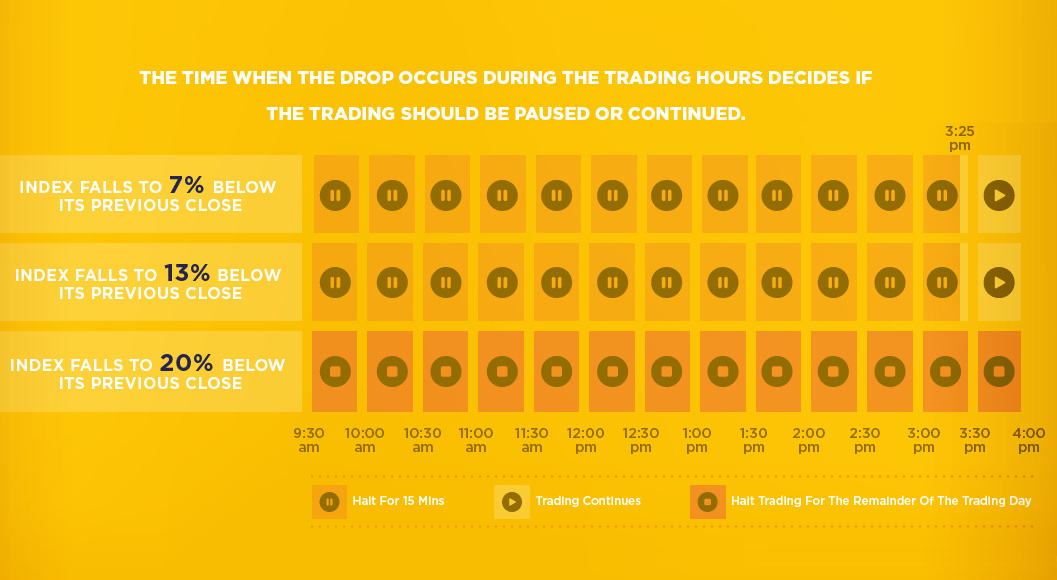
Previously, the Dow Jones Industrial Average (DJIA) was the bellwether for such market interventions. However, the most recent rules apply to the whole market when a precipitous drop in the S&P 500 occurs: Upon reaching each of the two first thresholds, a 15-minute halt in trading is prompted. This is the case unless the drop happens in the last 35 minutes of trading. Upon reaching the third threshold (-20% drop in S&P 500), the day’s trading is stopped altogether.
Can Circuit Breakers Stop a Market Crash?
In theory, the use of circuit breakers can help curb panic-selling, as well as limit opportunities for massive gains (or losses) within a short time frame. Further, by creating a window where trading is paused, circuit breakers help make time for market makers and institutional traders to make rational decisions. Regulators and exchanges hope that all of this together will give investors a chance to calm down, preventing the next market crash. But do circuit breakers actually work? While they make logical sense, recent evidence from China paints a murkier picture.
The Illusion of Safety
In Paul Kedrosky’s piece from The New Yorker, titled The Dubious Logic of Stock Market Circuit Breakers, he makes some interesting points on the series of market crashes in China from late-2015 to early-2016. – Paul Kedrosky, The New Yorker Kedrosky continues by explaining that a market participant in that situation would try to get as many sell orders in as possible, before the circuit breaker is triggered. Further, when the markets re-open, the same trader would again sell immediately to avoid the second breaker (which triggers an end in trading for the day). Each time the breakers get triggered, it creates a market memory of the events, and traders try to avoid future shutdowns by selling faster.
Preparation is Key
Whether they work or not, it is essential for investors to understand the rules behind circuit breakers, as well as how markets think and react after these pauses in action. In the event of a market crash, this preparation could help to make a difference. on Last year, stock and bond returns tumbled after the Federal Reserve hiked interest rates at the fastest speed in 40 years. It was the first time in decades that both asset classes posted negative annual investment returns in tandem. Over four decades, this has happened 2.4% of the time across any 12-month rolling period. To look at how various stock and bond asset allocations have performed over history—and their broader correlations—the above graphic charts their best, worst, and average returns, using data from Vanguard.
How Has Asset Allocation Impacted Returns?
Based on data between 1926 and 2019, the table below looks at the spectrum of market returns of different asset allocations:
We can see that a portfolio made entirely of stocks returned 10.3% on average, the highest across all asset allocations. Of course, this came with wider return variance, hitting an annual low of -43% and a high of 54%.
A traditional 60/40 portfolio—which has lost its luster in recent years as low interest rates have led to lower bond returns—saw an average historical return of 8.8%. As interest rates have climbed in recent years, this may widen its appeal once again as bond returns may rise.
Meanwhile, a 100% bond portfolio averaged 5.3% in annual returns over the period. Bonds typically serve as a hedge against portfolio losses thanks to their typically negative historical correlation to stocks.
A Closer Look at Historical Correlations
To understand how 2022 was an outlier in terms of asset correlations we can look at the graphic below:
The last time stocks and bonds moved together in a negative direction was in 1969. At the time, inflation was accelerating and the Fed was hiking interest rates to cool rising costs. In fact, historically, when inflation surges, stocks and bonds have often moved in similar directions. Underscoring this divergence is real interest rate volatility. When real interest rates are a driving force in the market, as we have seen in the last year, it hurts both stock and bond returns. This is because higher interest rates can reduce the future cash flows of these investments. Adding another layer is the level of risk appetite among investors. When the economic outlook is uncertain and interest rate volatility is high, investors are more likely to take risk off their portfolios and demand higher returns for taking on higher risk. This can push down equity and bond prices. On the other hand, if the economic outlook is positive, investors may be willing to take on more risk, in turn potentially boosting equity prices.
Current Investment Returns in Context
Today, financial markets are seeing sharp swings as the ripple effects of higher interest rates are sinking in. For investors, historical data provides insight on long-term asset allocation trends. Over the last century, cycles of high interest rates have come and gone. Both equity and bond investment returns have been resilient for investors who stay the course.