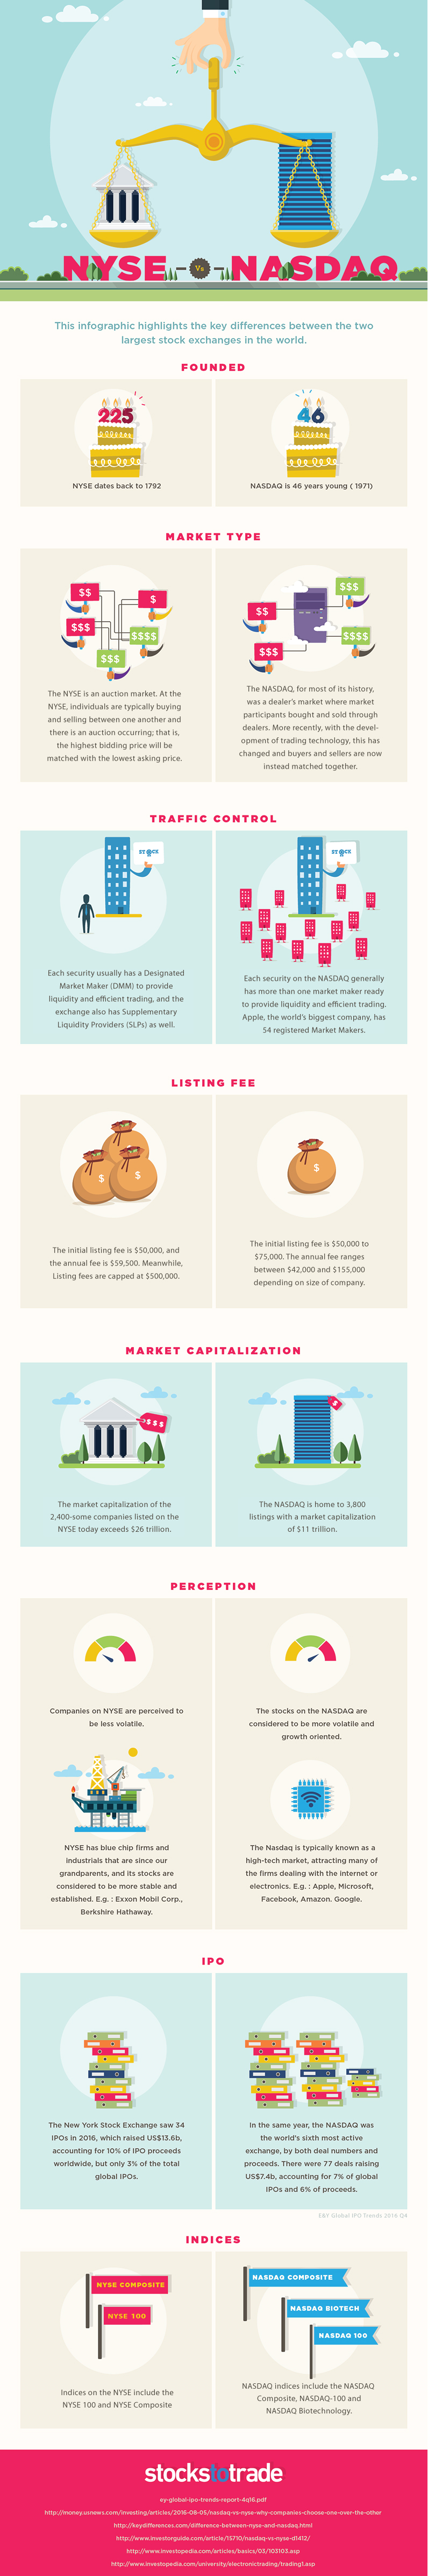
However, while they are both large American stock exchanges containing listings that are household names, they are also very different in how they work.
Comparing the NYSE and Nasdaq Exchanges
Today’s infographic from StocksToTrade.com explains the major differences between these two exchanges.
The NYSE and Nasdaq have significant differences, including the size and number of listings, how trades are made, and also how they are perceived by investors.
Size and Number of Listings
By the value of listed companies, the NYSE and Nasdaq are the two largest exchanges in the world. The NYSE has over 2,400 companies that combine for $26 trillion in market capitalization. It’s also home to many of the big “blue chip” companies that have existed for decades, like Walmart, Exxon Mobil, or General Electric. This is partly because the exchange has existed since 1792. In total, there are over 3,800 companies listed on the Nasdaq, worth a total of $11 trillion in market capitalization.
Operational Differences
Aside from the obvious differences in the size and types of listings, the NYSE and Nasdaq also have significant operational differences. The largest difference in the past was that the NYSE market was an auction market, while the Nasdaq was considered a dealer market. In the former, the highest bid for a stock is matched with the lowest asking price. In the latter, buying and selling happens in split seconds electronically through dealers. This difference has since changed as a result of trading technology, and both markets effectively connect buyers and sellers instantaneously in similar ways at the best price. The Nasdaq has multiple market makers per stock – and some, like Apple even have 54 such registered makers. Meanwhile, the NYSE usually has one Designated Market Maker (DMM) per stock that ensures a fair and orderly market in that security. The NYSE also uses Supplementary Liquidity Providers (SLPs) as well.
Different Perspectives
For various reasons, both stocks are seen a little differently by investors, as well. The NYSE is seen as the stock market for “tried and true” securities that have been, and will continue to be, the mainstays of the financial world for decades. The Nasdaq, on the other hand, is seen as a place for growth-oriented tech stocks. It was where the action was in the Dotcom boom and bust, and it’s the place where the world’s largest tech stocks are listed today.
on Last year, stock and bond returns tumbled after the Federal Reserve hiked interest rates at the fastest speed in 40 years. It was the first time in decades that both asset classes posted negative annual investment returns in tandem. Over four decades, this has happened 2.4% of the time across any 12-month rolling period. To look at how various stock and bond asset allocations have performed over history—and their broader correlations—the above graphic charts their best, worst, and average returns, using data from Vanguard.
How Has Asset Allocation Impacted Returns?
Based on data between 1926 and 2019, the table below looks at the spectrum of market returns of different asset allocations:
We can see that a portfolio made entirely of stocks returned 10.3% on average, the highest across all asset allocations. Of course, this came with wider return variance, hitting an annual low of -43% and a high of 54%.
A traditional 60/40 portfolio—which has lost its luster in recent years as low interest rates have led to lower bond returns—saw an average historical return of 8.8%. As interest rates have climbed in recent years, this may widen its appeal once again as bond returns may rise.
Meanwhile, a 100% bond portfolio averaged 5.3% in annual returns over the period. Bonds typically serve as a hedge against portfolio losses thanks to their typically negative historical correlation to stocks.
A Closer Look at Historical Correlations
To understand how 2022 was an outlier in terms of asset correlations we can look at the graphic below:
The last time stocks and bonds moved together in a negative direction was in 1969. At the time, inflation was accelerating and the Fed was hiking interest rates to cool rising costs. In fact, historically, when inflation surges, stocks and bonds have often moved in similar directions. Underscoring this divergence is real interest rate volatility. When real interest rates are a driving force in the market, as we have seen in the last year, it hurts both stock and bond returns. This is because higher interest rates can reduce the future cash flows of these investments. Adding another layer is the level of risk appetite among investors. When the economic outlook is uncertain and interest rate volatility is high, investors are more likely to take risk off their portfolios and demand higher returns for taking on higher risk. This can push down equity and bond prices. On the other hand, if the economic outlook is positive, investors may be willing to take on more risk, in turn potentially boosting equity prices.
Current Investment Returns in Context
Today, financial markets are seeing sharp swings as the ripple effects of higher interest rates are sinking in. For investors, historical data provides insight on long-term asset allocation trends. Over the last century, cycles of high interest rates have come and gone. Both equity and bond investment returns have been resilient for investors who stay the course.