For professional investors, talking about the yield curve is close to second nature – but to most regular folks, the words probably sound very abstract or esoteric.
What’s a Yield Curve?
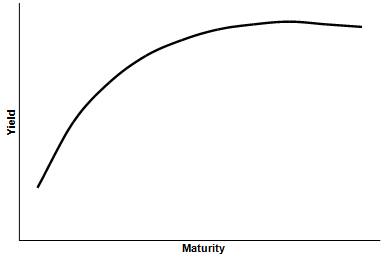
The yield curve is a curve showing several yields or interest rates across different bond contract lengths. In a normal credit environment, the premise is that yields are higher for longer maturity bonds.
In a way, this is similar to what you’d expect if you went to the bank and put your money into a time deposit. For example, if you put your money in for five years, you’d expect a higher return per year than if you put your money in for six months. Why? You’re taking on more risk, and therefore deserve a higher rate of compensation.
Out of Whack
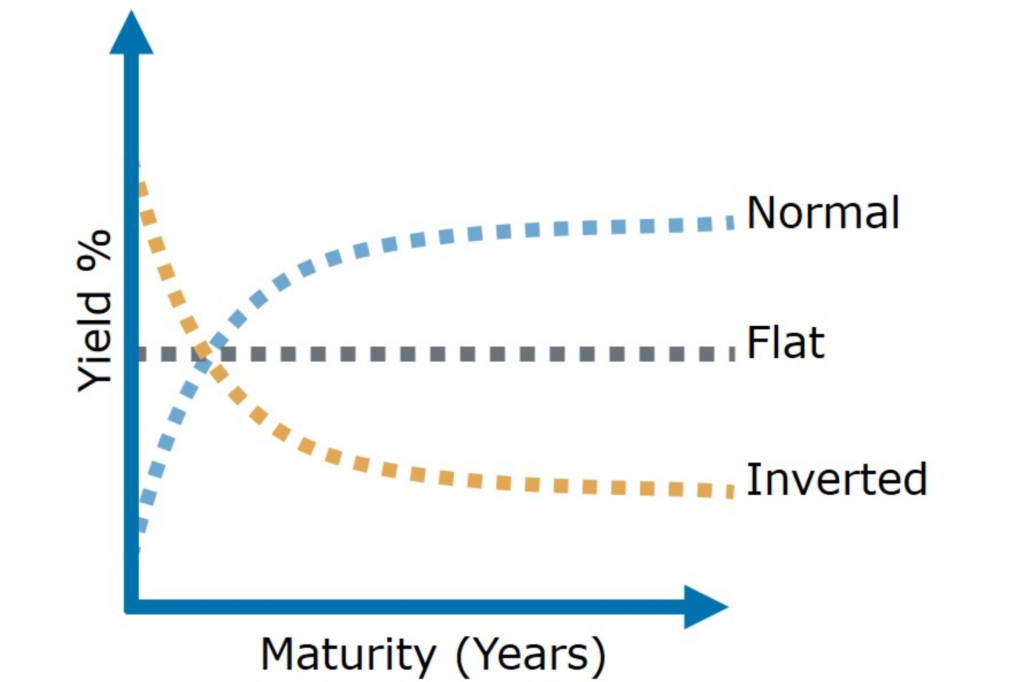
Sometimes the market gets out of whack, and yield curves do some interesting things.
As you can see above, sometimes long-term interest rates can be equal to those of short-term rates. This is called a “flat” yield curve. Or, when long-term rates fall below short-term rates, that is an “inverted” yield curve. As you’ll see shortly, this can be a signal of trouble in credit markets and the greater economy as a whole.
The Curve Everyone is Talking about
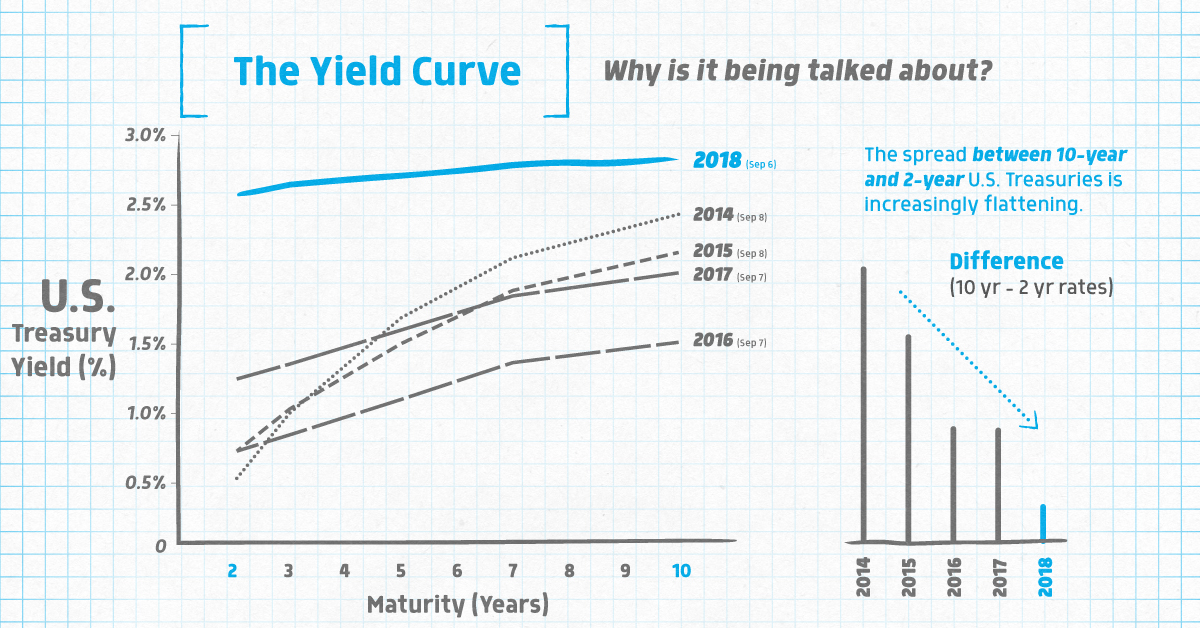
While a yield curve can be shown for any bond, there is one particular yield curve that you’ll often see referenced by financial journalists and analysts. That would be the yield curve for U.S. Treasuries, the bonds issued by the U.S. federal government to fund its activities. More specifically, the difference between 10-year and 2-year bonds has been a historical indicator of the health of the economy and markets. And despite this curve looking pretty normal since the financial crisis, it has been flattening over time:
In 2014, the difference for 10-year and 2-year bonds was 1.94%. Today, the difference is just 0.24%!
Why It Matters
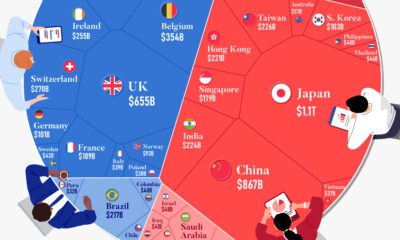
There are various interpretations out there of what an inverted yield curve could mean for markets. There are also pundits out there who say things are different this time around. There is some validity to this, as things are never cut and dry in economics. Besides, this wouldn’t be the first time that global credit markets have acted in strange ways since the crisis. That all said, the reason the inverted yield curve is a topic of conversation is simple: inverted yield curves have preceded every post-war U.S. recession. So now you know what the fuss is about – and maybe, just maybe, you’re more inclined to dive deeper into the exciting world of yield curves. on These are in the form of Treasury securities, some of the most liquid assets worldwide. Central banks use them for foreign exchange reserves and private investors flock to them during flights to safety thanks to their perceived low default risk. Beyond these reasons, foreign investors may buy Treasuries as a store of value. They are often used as collateral during certain international trade transactions, or countries can use them to help manage exchange rate policy. For example, countries may buy Treasuries to protect their currency’s exchange rate from speculation. In the above graphic, we show the foreign holders of the U.S. national debt using data from the U.S. Department of the Treasury.
Top Foreign Holders of U.S. Debt
With $1.1 trillion in Treasury holdings, Japan is the largest foreign holder of U.S. debt. Japan surpassed China as the top holder in 2019 as China shed over $250 billion, or 30% of its holdings in four years. This bond offloading by China is the one way the country can manage the yuan’s exchange rate. This is because if it sells dollars, it can buy the yuan when the currency falls. At the same time, China doesn’t solely use the dollar to manage its currency—it now uses a basket of currencies. Here are the countries that hold the most U.S. debt: As the above table shows, the United Kingdom is the third highest holder, at over $655 billion in Treasuries. Across Europe, 13 countries are notable holders of these securities, the highest in any region, followed by Asia-Pacific at 11 different holders. A handful of small nations own a surprising amount of U.S. debt. With a population of 70,000, the Cayman Islands own a towering amount of Treasury bonds to the tune of $284 billion. There are more hedge funds domiciled in the Cayman Islands per capita than any other nation worldwide. In fact, the four smallest nations in the visualization above—Cayman Islands, Bermuda, Bahamas, and Luxembourg—have a combined population of just 1.2 million people, but own a staggering $741 billion in Treasuries.
Interest Rates and Treasury Market Dynamics
Over 2022, foreign demand for Treasuries sank 6% as higher interest rates and a strong U.S. dollar made owning these bonds less profitable. This is because rising interest rates on U.S. debt makes the present value of their future income payments lower. Meanwhile, their prices also fall. As the chart below shows, this drop in demand is a sharp reversal from 2018-2020, when demand jumped as interest rates hovered at historic lows. A similar trend took place in the decade after the 2008-09 financial crisis when U.S. debt holdings effectively tripled from $2 to $6 trillion.
Driving this trend was China’s rapid purchase of Treasuries, which ballooned from $100 billion in 2002 to a peak of $1.3 trillion in 2013. As the country’s exports and output expanded, it sold yuan and bought dollars to help alleviate exchange rate pressure on its currency. Fast-forward to today, and global interest-rate uncertainty—which in turn can impact national currency valuations and therefore demand for Treasuries—continues to be a factor impacting the future direction of foreign U.S. debt holdings.