Recent increases to the debt have been fueled by massive fiscal stimulus bills like the CARES Act ($2.2 trillion in March 2020), the Consolidated Appropriations Act ($2.3 trillion in December 2020), and most recently, the American Rescue Plan ($1.9 trillion in March 2021). To see how America’s debt has gotten to its current point, we’ve created an interactive timeline using data from the Congressional Budget Office (CBO). It’s crucial to note that the data set uses U.S. national debt held by the public, which excludes intergovernmental holdings. *Editor’s note: This top level figure includes intragovernmental holdings, or the roughly $6 trillion of debt owed within the government to itself.
What Influences U.S. Debt?
It’s worth pointing out that the national debt hasn’t always been this large. Looking back 150 years, we can see that its size relative to GDP has fluctuated greatly, hitting multiple peaks and troughs. These movements generally correspond with events such as wars and recessions. Source: CBO, The Balance To gain further insight into the history of the U.S. national debt, let’s review some key economic events in America’s history.
The Great Depression
After its WWI victory, the U.S. enjoyed a period of post-war prosperity commonly referred to as the Roaring Twenties. This led to the creation of a stock market bubble which would eventually burst in 1929, causing massive damage to the U.S. economy. The country’s GDP was cut in half (partially due to deflation), while the unemployment rate rose to 25%. Government revenues dipped as a result, pushing debt held by the public as a % of GDP from its low of 15% in 1929, to a high of 44% in 1934.
World War II
WWII quickly brought the U.S. back to full employment, but it was an incredibly expensive endeavor. The total cost of the war is estimated to be over $4 trillion in today’s dollars. To finance its efforts, the U.S. relied heavily on war bonds, a type of bond that is marketed to citizens during armed conflicts. These bonds were sold in various denominations ranging from $25-$10,000 and had a 2.9% interest rate compounded semiannually. Over 85 million Americans purchased these bonds, helping the U.S. government to raise $186 billion (not adjusted for inflation). This pushed debt above 100% of GDP for the first time ever, but was also enough to cover 63% of the war’s total cost.
The Postwar Period
Following World War II, the U.S. experienced robust economic growth. Despite involvement in the Korea and Vietnam wars, debt-to-GDP declined to a low of 23% in 1974—largely because these wars were financed by raising taxes rather than borrowing. The economy eventually slowed in the early 1980s, prompting President Reagan to slash taxes on corporations and high earning individuals. Income taxes on the top bracket, for example, fell from 70% to 50%.
2008 Global Financial Crisis
The Global Financial Crisis served as a precursor for today’s debt landscape. Interest rates were reduced to near-zero levels to speed up the economic recovery, enabling the government to borrow with relative ease. Rates remained at these suppressed levels from 2008 to 2015, and debt-to-GDP grew from 39% to 73%. It’s important to note that even before 2008, the U.S. government had been consistently running annual budget deficits. This means that the government spends more than it earns each year through taxes.
The National Debt Today
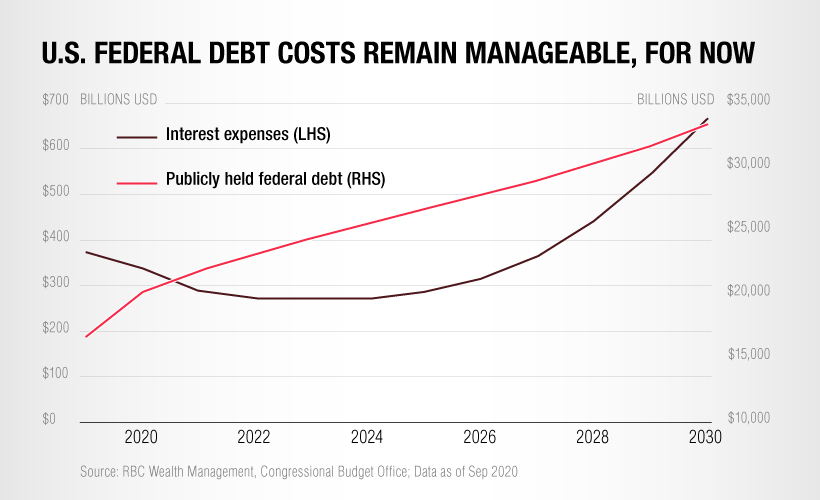
The COVID-19 pandemic damaged many areas of the global economy, forcing governments to drastically increase their spending. At the same time, many central banks once again reduced interest rates to zero. This has resulted in a growing snowball of government debt that shows little signs of shrinking, even though the worst of the pandemic is already behind us. In the U.S., federal debt has reached or surpassed WWII levels. When excluding intragovernmental holdings, it now sits at 104% of GDP—and including those holdings, it sits at 128% of GDP. But while the debt is expected to grow even further, the cost of servicing this debt has actually decreased in recent years.
This is because existing government bonds, which were originally issued at higher rates, are now maturing and being refinanced to take advantage of today’s lower borrowing costs. The key takeaway from this is that the U.S. national debt will remain manageable for the foreseeable future. Longer term, however, interest expenses are expected to grow significantly—especially if interest rates begin to rise again. on Both figures surpassed analyst expectations by a wide margin, and in January, the unemployment rate hit a 53-year low of 3.4%. With the recent release of February’s numbers, unemployment is now reported at a slightly higher 3.6%. A low unemployment rate is a classic sign of a strong economy. However, as this visualization shows, unemployment often reaches a cyclical low point right before a recession materializes.
Reasons for the Trend
In an interview regarding the January jobs data, U.S. Treasury Secretary Janet Yellen made a bold statement: While there’s nothing wrong with this assessment, the trend we’ve highlighted suggests that Yellen may need to backtrack in the near future. So why do recessions tend to begin after unemployment bottoms out?
The Economic Cycle
The economic cycle refers to the economy’s natural tendency to fluctuate between periods of growth and recession. This can be thought of similarly to the four seasons in a year. An economy expands (spring), reaches a peak (summer), begins to contract (fall), then hits a trough (winter). With this in mind, it’s reasonable to assume that a cyclical low in the unemployment rate (peak employment) is simply a sign that the economy has reached a high point.
Monetary Policy
During periods of low unemployment, employers may have a harder time finding workers. This forces them to offer higher wages, which can contribute to inflation. For context, consider the labor shortage that emerged following the COVID-19 pandemic. We can see that U.S. wage growth (represented by a three-month moving average) has climbed substantially, and has held above 6% since March 2022. The Federal Reserve, whose mandate is to ensure price stability, will take measures to prevent inflation from climbing too far. In practice, this involves raising interest rates, which makes borrowing more expensive and dampens economic activity. Companies are less likely to expand, reducing investment and cutting jobs. Consumers, on the other hand, reduce the amount of large purchases they make. Because of these reactions, some believe that aggressive rate hikes by the Fed can either cause a recession, or make them worse. This is supported by recent research, which found that since 1950, central banks have been unable to slow inflation without a recession occurring shortly after.
Politicians Clash With Economists
The Fed has raised interest rates at an unprecedented pace since March 2022 to combat high inflation. More recently, Fed Chairman Jerome Powell warned that interest rates could be raised even higher than originally expected if inflation continues above target. Senator Elizabeth Warren expressed concern that this would cost Americans their jobs, and ultimately, cause a recession. Powell remains committed to bringing down inflation, but with the recent failures of Silicon Valley Bank and Signature Bank, some analysts believe there could be a pause coming in interest rate hikes. Editor’s note: just after publication of this article, it was confirmed that U.S. interest rates were hiked by 25 basis points (bps) by the Federal Reserve.