Consumption levels, and types of alcohol consumed, vary widely based on location. Furthermore, the availability of fruits and grains used in alcohol production impacts which drinks are more commonly consumed, as does the predominant culture. Some cultures see alcohol consumption as a pleasurable experience, while others see intoxication as a sin. There’s also the question of economics and availability. It’s strange, but in some regions of the world, industrially mass-produced alcohol can flood markets and become cheaper than other beverages, including water. When we map alcohol consumption by capita, and by different types of alcohol, these local and cultural stories come to light. The above maps use recorded consumption data from WHO for 2019, in liters of pure alcohol.
Europe Leads in Per Capita Alcohol Consumption
The top 10 countries by alcohol consumption highlight the prominence of alcoholic beverages in European culture. Eight of the 10 countries with the top alcohol consumption per capita were in Europe. Primarily, they were Eastern and Central European countries, including #2 Latvia, #3 Czech Republic, #4 Lithuania, and #5 Austria. But the crown of alcohol consumption per capita goes to the Cook Islands, which leads the world with an annual per capita consumption of 13L (3.4 gallons) of alcohol. At the bottom of the consumption charts? Not surprisingly, it’s Bangladesh, Saudi Arabia, Kuwait, and other Muslim countries where intoxication is religiously prohibited.
Regional Disparities in Alcohol Consumption
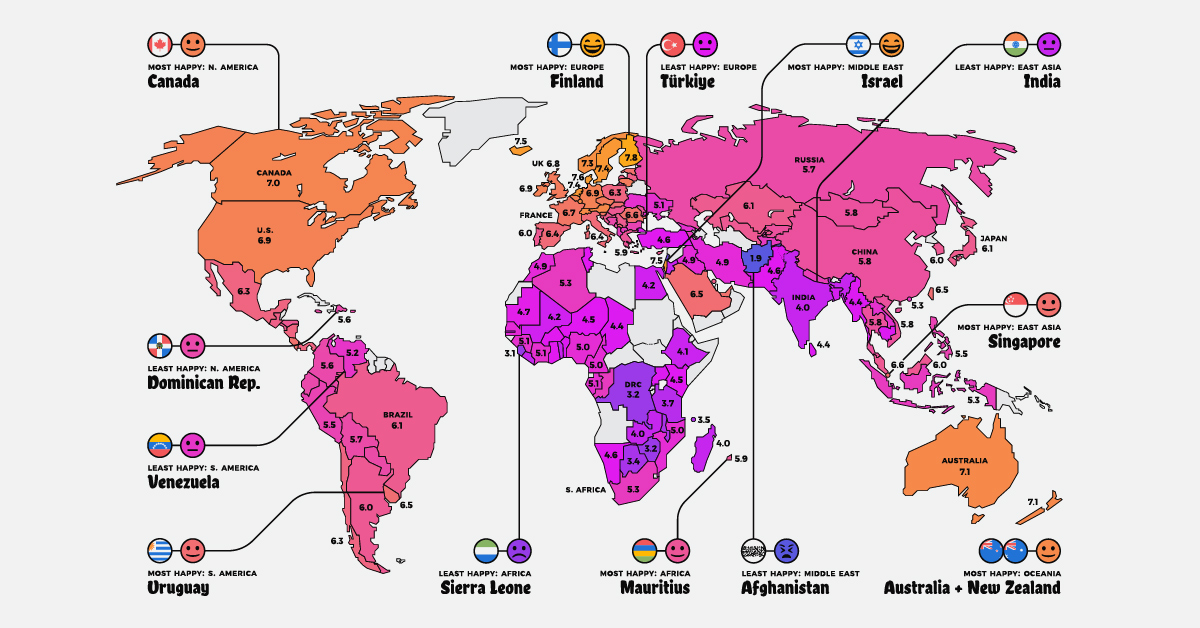
Per capita consumption of alcohol also highlights clear regional preferences in amount and type, or a lack of interest. The biggest consumers of alcohol are countries in Central Europe, the South Pacific, and parts of the Caribbean. In Europe, beer and wine are kings, with most of the top consumers also being top producers such as France and Germany. Spirits like rum, meanwhile, are dominant in the Cook Islands and much of the Caribbean, which has four of the 12 top spirit consumers. The others are mainly in Eastern Europe and Russia, which get most of their alcohol consumption from vodka. The importance of local crops couldn’t be overstated. Regions like Africa and Asia that struggle with the right conditions for grapes or hops saw higher consumption of “other” distilled drinks. These include rice alcohol in South Korea and Japan, and drinks made from sugarcane, molasses, and even bananas in African countries like Tanzania. Unlike goods like coffee or tea, alcohol can be produced from many different grains, fruits, or sources of sugar that can be fermented—so it’s natural that regional differences in types, amounts, and even cultural importance would arise. But as one of the world’s most widely used recreational drugs, it’s played a storied role throughout history that is certain to continue evolving. on Are wealth and prosperity legitimate measures of happiness? How about safety and health outcomes? In the West, we view democracy as a key component to happiness, yet there are countries under authoritarian rule that score high in the Happiness Index. Questions like these make “ranking happiness” a particularly challenging puzzle, but also one worth pursuing. If policymakers have a clearer picture of what conditions can foster happiness, they can enact policies that can improve the lives of people living their jurisdictions. The map above is a global snapshot of life satisfaction around the world. It utilizes the World Happiness Report—an annual survey of how satisfied citizens are worldwide—to map out the world’s happiest and least happy countries. To create the index the map is based on, researchers simply asked people how satisfied they are with their lives. Scores were assigned using these self-reported answers from people living within various countries, as well as quality of life factors. While there may be no perfect measure of happiness around the world, the report is a robust and transparent attempt to understand happiness at the global level. For more detailed notes on the report’s methodology and more, we recommend viewing the info box at the end of this article. Now, let’s look at the world’s happiest countries in 2023.
Global Happiness, by Country
Global happiness currently averages out to 5.5 out of 10, a decrease of 0.1 from last year. Below is a look at every country’s score: Note: Scores have been rounded to the first decimal place. European countries make up the bulk of the top 10, with Israel (#4) and New Zealand (#10) also making it into the top ranks. Finland sits at the very top of the ranking for the sixth year in a row. Now let’s look at the world’s happiest countries on a more regional basis.
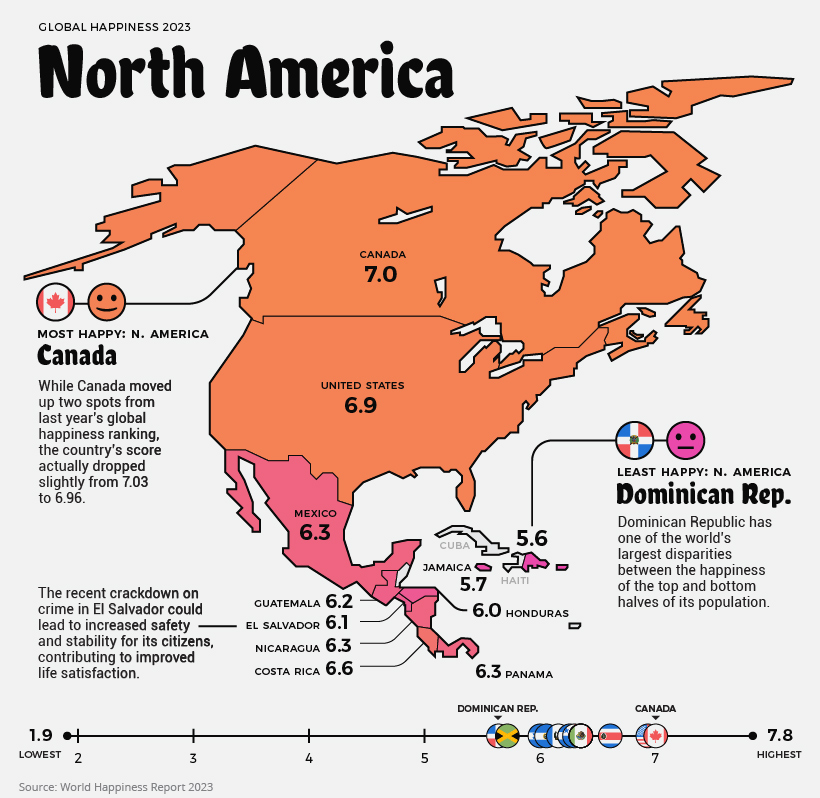
North America
Current Mood: Happy (6.3)
North America’s happiness score averages out to 6.3/10. The happiest country in the region is Canada, slightly beating out the United States. However, the scores of both countries have actually decreased from last year. It’s difficult to pinpoint why citizens feel less satisfied, but inflation, economic uncertainty, and many other factors could play a role. The only countries to see improvement in North America were Nicaragua and Jamaica. Although a more recent development, many Jamaicans could be experiencing even more happiness in the near future, with a recent announcement of plans to increase the minimum wage by 44%.
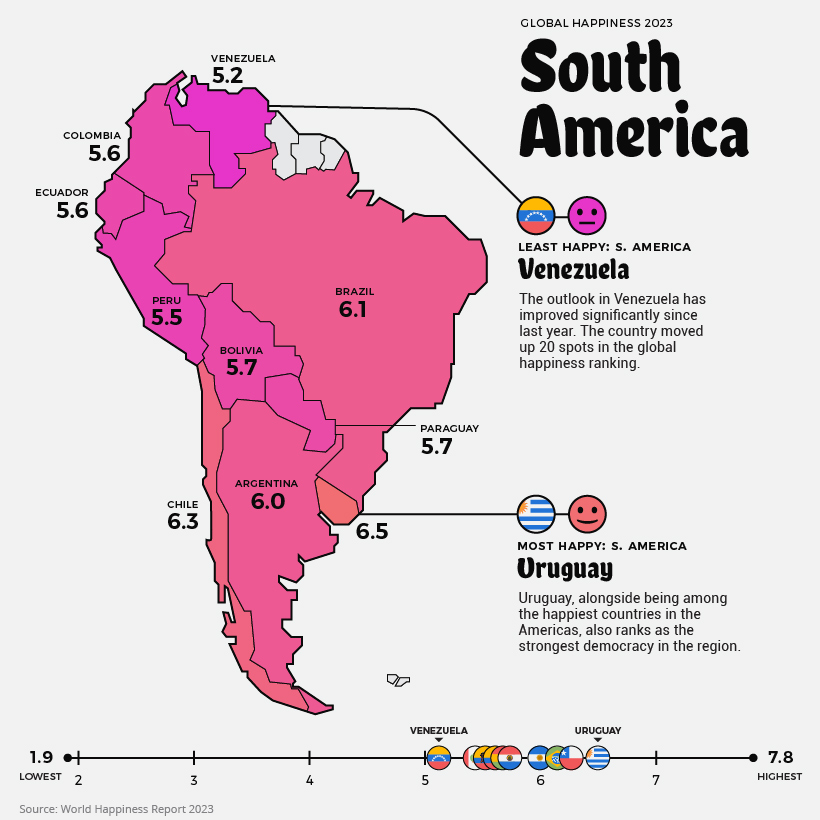
South America
Current Mood: Content (5.8)
South America’s average score is 5.8. Although Venezuela is the continent’s least happy country, its score actually improved from 4.9 to 5.2. That said, the ongoing humanitarian and economic crisis is not likely to instill much hope into the average Venezuelan. Over 6.8 million people have fled the struggling nation since 2014. The two countries in the region with decreased scores were Brazil and Colombia, where citizens have reported feeling worse compared to the year before.
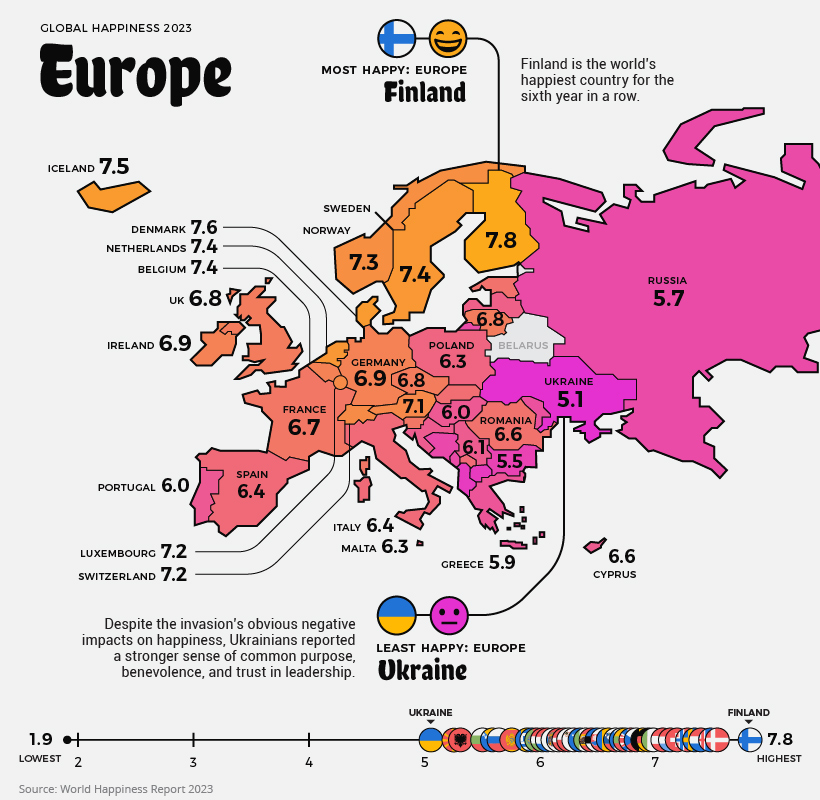
Europe
Current Mood: Happy (6.4)
Europe has some of the world’s happiest countries, with an average regional score of 6.4. Nordic countries like Finland, Sweden, and Iceland repeatedly report high scores, meaning people in these countries feel extremely satisfied with their lives.
Despite fending off an invasion, Ukrainians saw no diminishment of their happiness year-over-year, and many are feeling resilient and purposeful in their fight for freedom. Interestingly, Russia’s score actually increased slightly compared to last year, going from 5.5 to 5.7.
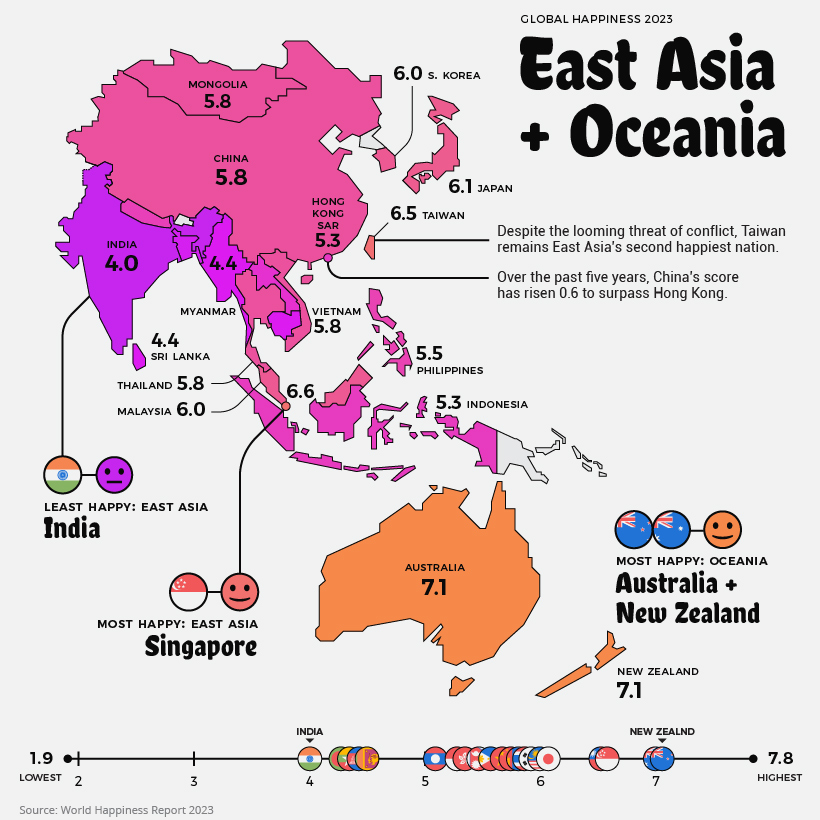
East Asia and Oceania
Current Mood: Neutral (5.6)
East Asia and Oceania’s collective average is 5.6. Oceania alone, however, would have the highest regional score in the world, at 7.1. Bucking conventional wisdom—at least in the West—China has seen a noteworthy bump (+0.6) in its score in recent years. Across the strait, Taiwan records the second highest score in East Asia, after Singapore. India once again has the lowest happiness score in its region. The country’s score has dropped -0.7 over the past decade.
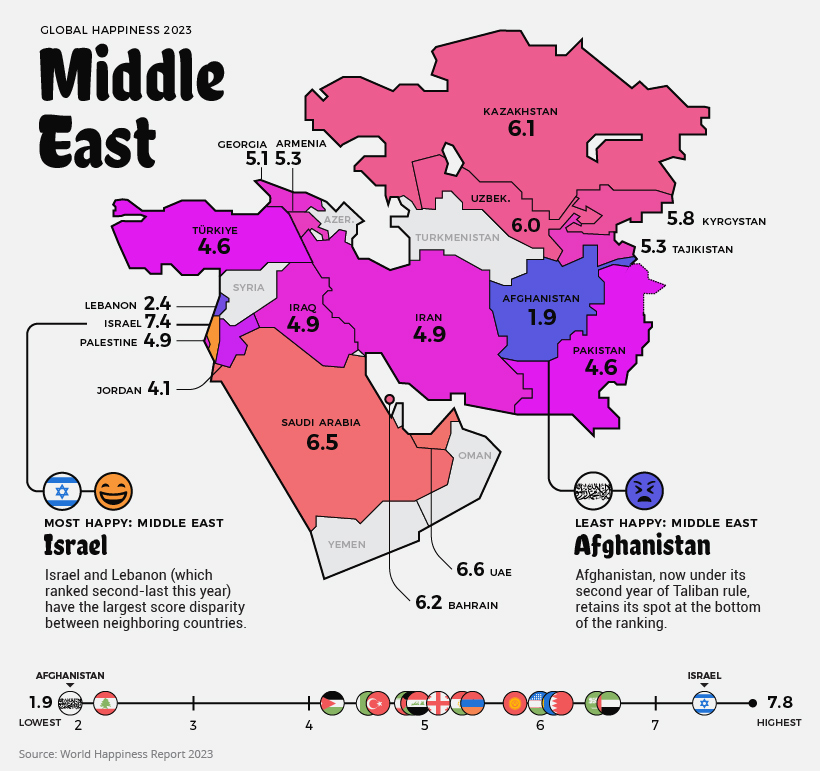
Central Asia and The Middle East
Current Mood: It’s Complicated (5.2)
The average score in the Middle East and Central Asia is 5.2, and the array of happiness scores is wider than in any other region. Afghanistan is the world’s least happy country, with citizens having reported extremely low levels of life satisfaction. Since the Taliban takeover, life has become objectively worse for Afghans, particularly women. There is a lot of conflict in the region. Citizens of Armenia face particular tension with neighboring Azerbaijan, whose score was not recorded for this year. Conflicts in the Nagorno-Karabakh region have led to hundreds of deaths since 2020 and cause daily struggle for those who live in the disputed territory. Iran is still under economic sanctions and faces ongoing tensions with the U.S. and Israel. Some countries, like Syria and Yemen, are so destabilized that no data is available. Still, there are bright spots as well. Israel has one of the world’s happiest countries with a top 10 score this year, and Saudi Arabia and the UAE have scores on par with many European countries.
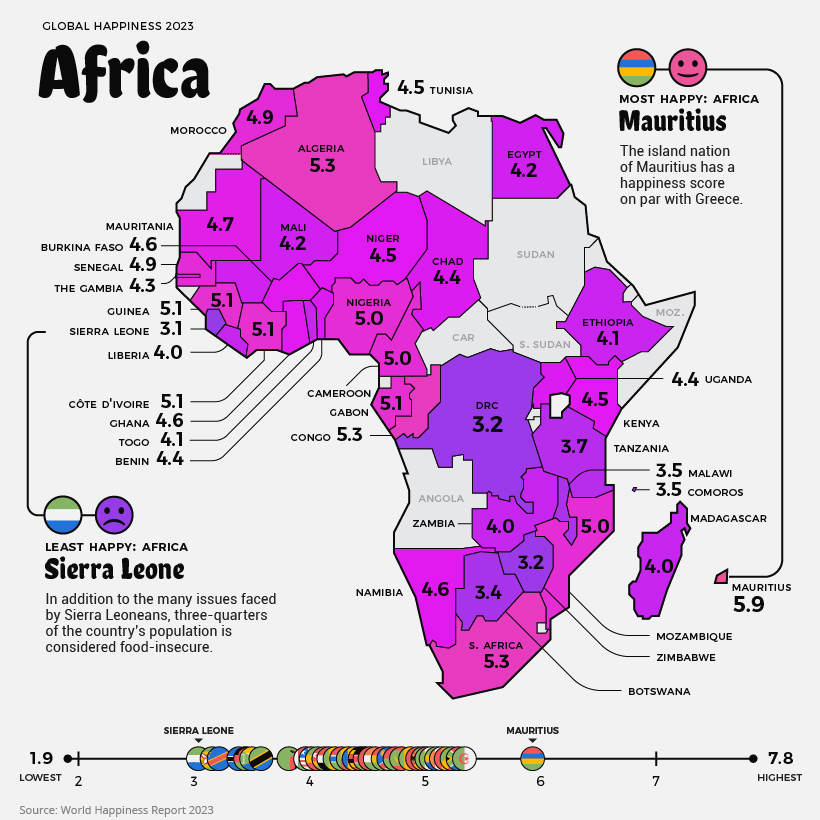
Africa
Current Mood: Unhappy (4.4)
The least happy region, Africa, averages out to a score of 4.4, and there is a lot of regional variation. The highest score in Africa goes to the island nation of Mauritius. In addition to the country’s natural beauty and stability, there is growing economic opportunity. Mauritius is classified as an upper-middle-income country by World Bank, and is one of the fastest growing high-income markets in the world. Sierra Leone has the lowest score of African countries that were included in the index, followed by Zimbabwe and the Democratic Republic of the Congo. It’s worth noting, there are a few data gaps in the region, including Burundi, which is currently the poorest country in the world. Source: The World Happiness Report which leverages data from the Gallup World Poll. Methodology: A nationally representative group of approximately 1,000 people is asked a series of questions relating to their life satisfaction, as well as positive and negative emotions they are experiencing. The life evaluation question is based on the Cantril ladder, wherein the top of the ladder represents the best possible life for a person (a score of 10/10) and on the flipside, the worst possible life (scored as 0/10). The main takeaway is that the scores result from self-reported answers by citizens of each of these countries. The results received a confidence interval of 95%, meaning that there is a 95% chance that the answers and population surveyed represent the average. As well, scores are averaged over the past three years in order to increase the sample size of respondents in each country. Criticisms: Critics of the World Happiness Report point out that survey questions measure satisfaction with socioeconomic conditions as opposed to individual emotional happiness. As well, there are myriad cultural differences around the world that influence how people think about happiness and life satisfaction. Finally, there can be big differences in life satisfaction between groups within a country, which are averaged out even in a nationally representative group. The report does acknowledge inequality as a factor by measuring the “gap” between the most and least happy halves of each country.