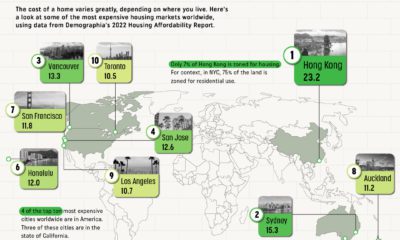
This visual, using data from Home Sweet Home, maps out the annual salary you’d need for home ownership in 50 different U.S. cities. Note: The map above refers to entire metro areas and uses Q1 2022 data on median home prices. The necessary salary was calculated by the source, looking at the base cost of principal, interest, property tax, and homeowner’s insurance.
Home Ownership Across the U.S.
San Jose is by far the most expensive city when it comes to purchasing a home. A person would need to earn over $330,000 annually to pay off the mortgage at a monthly rate of $7,718. Here’s a closer look at the numbers: Perhaps surprisingly, Boston residents need slightly higher earnings than New Yorkers to buy a home. The same is also true in Seattle and Los Angeles. Meanwhile, some of the cheapest cities to start buying up real estate in are Oklahoma City and Cleveland. As of April, the rate of home ownership in the U.S. is 65%. This number represents the share of homes that are occupied by the owner, rather than rented out or vacant.
The American Dream Home
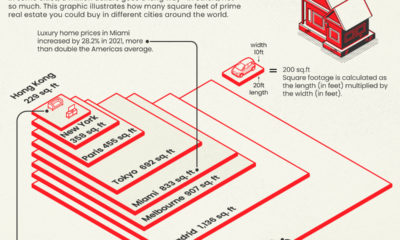
As of the time of this data (Q1 2022), the national yearly fixed mortgage rate sat at 4% and median home price at $368,200. This put the salary needed to buy a home at almost $76,000—the median national household income falls almost $9,000 below that. But what kind of homes are people looking to purchase? Depending on where you live the type of home and square footage you can get will be very different. In New York City, for example, there are fairly few stand-alone, single-family houses in the traditional sense—only around 4,000 are ever on the market. People in the Big Apple tend to buy condominiums or multi-family units. Additionally, if you’re looking for luxury, not even seven figures will get you much in the big cities. In Miami, a million dollars will only buy you 833 square feet of prime real estate. One thing is for sure: the typical American dream home of the big house with a yard and white picket fence is more attainable in smaller metro areas with ample suburbs.
Buying vs. Renting
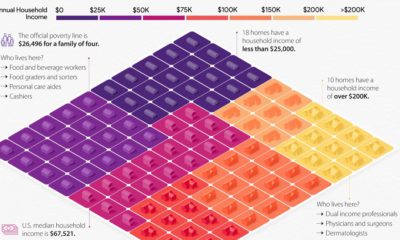
The U.S. median household income is $67,500, meaning that today the typical family could only afford a home in about 15 of the 50 metro areas highlighted above, including New Orleans, Buffalo, and Indianapolis. With the income gap widening in the U.S., the rental market remains a more attractive option for many, especially as prices are finally tapering off. The national median rent price was down nearly 3% from June to July for two-bedroom apartments. At the end of the day, buying a home can be an important investment and may provide a sense of security, but it will be much easier to do in certain types of cities. on Cities become “expensive” due to a variety of factors such as high demand for housing, a concentration of high-paying businesses and industries, and a high standard of living. Additionally, factors such as taxes, transportation costs, and availability of goods and services can also contribute to the overall cost of living in global cities. The infographic above uses data from EIU to rank the world most and least expensive cities to live in. To make the list, the EIU examines 400+ prices for over 200 products and services in 172 cities, surveying a variety of businesses to track price fluctuations over the last year.
Inflation + Strong Currency = Expensive Cities
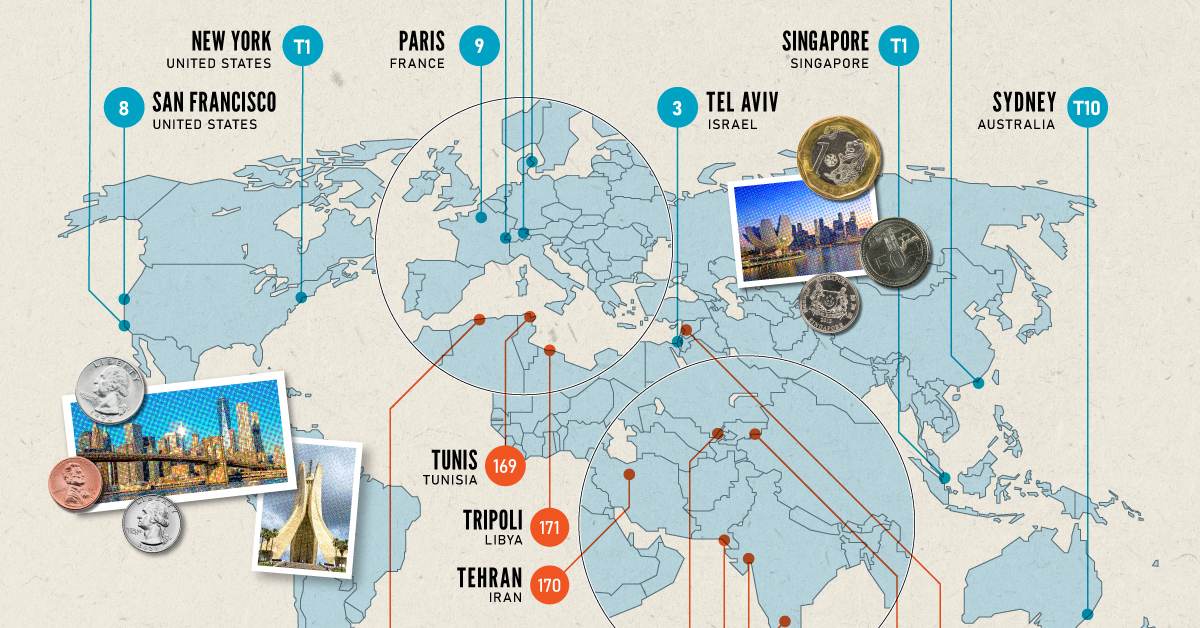
If you live in a city where many residents find it challenging to put a roof over their heads, food on their plates, and make ends meet, you live in an expensive city. But if this inflation is compounded with a strong national currency, you may live in one of the world’s most expensive cities. Singapore and New York City tied for the first rank amongst the world’s most expensive cities in 2022, pushing Israel’s Tel Aviv from the first place in 2021 to the third place in 2022. Both these cities had high inflation and a strong currency. Surprisingly, this is the Big Apple’s first time atop the ranking. The city with one of the most expensive real estate markets worldwide, Hong Kong ranked fourth in this list, followed by Los Angeles, which moved up from its ninth rank in 2021.
Poor Economies = Cheaper Cities
Asia continues to dominate the list of the world’s least expensive cities, followed by parts of North Africa and the Middle East. Though affordability sounds good at face value, sitting at the bottom of the ranking isn’t necessarily a coveted position. While the cost of living in some of the cities in these nations is low, it comes at the price of a weak currency, poor economy, and, in many cases, political and economic turmoil. The decade-long conflict in Syria weakened the Syrian pound, led to a spiraling inflation and fuel shortages, and further collapsed its economy. It’s no surprise that its capital city of Damascus has maintained its position as the world’s cheapest city. Tripoli and Tehran, the capitals of Libya and Iran, respectively, follow next on this list, reflecting their weakened economies. Meanwhile, seven cities in Asia with the common denominator of high-income inequality and low wages dominate the list of the world’s cheapest cities. These include three Indian cities, Tashkent in Uzbekistan, Almaty in Kazakhstan, Pakistan’s most populous city of Karachi, and Sri Lankan capital–Colombo.
