Throughout history, it was typical to see both birth and death rates at higher levels. But today, in most parts of the world, women are having fewer children, and innovations in healthcare and technology mean we are all living longer. The average person today lives to 72.6 years old, while the rate of births per woman has fallen to 2.5. These trends have drastically altered the demographics of mature economies, resulting in a much older population. In many developing countries, however, births still outweigh deaths, resulting in populations that skew younger. This visualization uses data from the World Bank to examine the countries with the highest shares of old and young people.
The Fountain of Youth
By 2030, the United Nations estimates there will be 1.3 billion people on the planet between the ages of 15-24. Proving to be a fountain of youth globally, the continent of Africa boasts the top 10 countries with the largest shares of young people in the world. Somalia, Zambia, and the DRC are just a few to crack the top 10 list. The youngest country in the world is Niger, where almost 50% of the population is below the age of 15. Here’s a full list of global countries, sorted by percentage of population under 15 years old: Young countries have significant opportunities ahead of them. A younger population means a larger upcoming workforce and more opportunities for innovation and economic growth. While domestic markets in Africa grow in terms of labor supply, innovation, and potential consumers, there are also challenges that arise in these countries. Corruption, political instability and unemployment, particularly in Africa, are all potential barriers to prosperity for the continent’s Gen Z population.
Populations Skewing Older
The world’s oldest country is Japan, where 28% of the population is older than 65. However, it’s an anomaly—the rest of the oldest countries in the top 10 are all in Europe. Globally, it’s the 65+ age group that is growing the fastest. According to the same UN estimates, it is predicted that by 2050 that one in six people will be over 65 years old. Here’s a full list of global countries, sorted by percentage of population over 65 years old: Fewer births, and a resulting older population, is a trend attributed to the changing lifestyles of women. For example, Japan’s fertility rate has fallen to less than 1.5 children per woman due to modern access to contraceptives and the prioritization of work over marriage and family life. However, fewer young people also means a smaller workforce on the horizon and a shrinking domestic market. There is also a rising social cost of caring for the elderly, as longer lifespans have resulted in a higher prevalence of chronic diseases and an increasing inability to care for oneself. This can result in an increased tax burden on the diminishing younger, working population.
Another Perspective on the Data
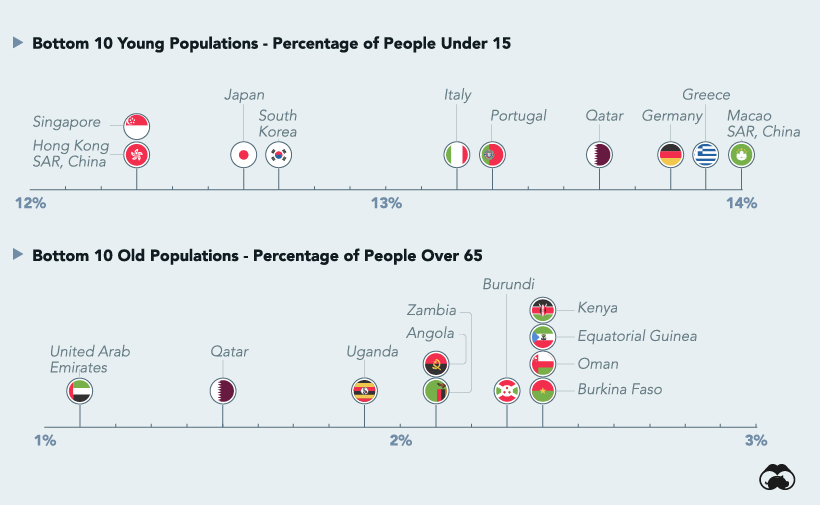
Looking at the data from the opposite angle also reveals information about our world. Here’s a look at the countries with the lowest proportions of younger or older people.
Hong Kong and Singapore have some of the lowest fertility rates in the world (1.1), so it’s no surprise to see low numbers of children in their demographic data. In a country like the United Arab Emirates, the majority of the population is made up of foreign workers, so the number of people in the 65+ age group is extremely low. In the coming decades though, the situation is expected to shift dramatically with one in every five Emiratis residing that age group by 2050.
The Big Picture
While each country has its own unique demographic make up, one thing is clear. As education and wealth levels rise around the world, fertility rates are dropping almost everywhere. The trend of long life expectancies and fewer births is likely to continue, but young outliers will remain and they present immense economic potential. on Last year, stock and bond returns tumbled after the Federal Reserve hiked interest rates at the fastest speed in 40 years. It was the first time in decades that both asset classes posted negative annual investment returns in tandem. Over four decades, this has happened 2.4% of the time across any 12-month rolling period. To look at how various stock and bond asset allocations have performed over history—and their broader correlations—the above graphic charts their best, worst, and average returns, using data from Vanguard.
How Has Asset Allocation Impacted Returns?
Based on data between 1926 and 2019, the table below looks at the spectrum of market returns of different asset allocations:
We can see that a portfolio made entirely of stocks returned 10.3% on average, the highest across all asset allocations. Of course, this came with wider return variance, hitting an annual low of -43% and a high of 54%.
A traditional 60/40 portfolio—which has lost its luster in recent years as low interest rates have led to lower bond returns—saw an average historical return of 8.8%. As interest rates have climbed in recent years, this may widen its appeal once again as bond returns may rise.
Meanwhile, a 100% bond portfolio averaged 5.3% in annual returns over the period. Bonds typically serve as a hedge against portfolio losses thanks to their typically negative historical correlation to stocks.
A Closer Look at Historical Correlations
To understand how 2022 was an outlier in terms of asset correlations we can look at the graphic below:
The last time stocks and bonds moved together in a negative direction was in 1969. At the time, inflation was accelerating and the Fed was hiking interest rates to cool rising costs. In fact, historically, when inflation surges, stocks and bonds have often moved in similar directions. Underscoring this divergence is real interest rate volatility. When real interest rates are a driving force in the market, as we have seen in the last year, it hurts both stock and bond returns. This is because higher interest rates can reduce the future cash flows of these investments. Adding another layer is the level of risk appetite among investors. When the economic outlook is uncertain and interest rate volatility is high, investors are more likely to take risk off their portfolios and demand higher returns for taking on higher risk. This can push down equity and bond prices. On the other hand, if the economic outlook is positive, investors may be willing to take on more risk, in turn potentially boosting equity prices.
Current Investment Returns in Context
Today, financial markets are seeing sharp swings as the ripple effects of higher interest rates are sinking in. For investors, historical data provides insight on long-term asset allocation trends. Over the last century, cycles of high interest rates have come and gone. Both equity and bond investment returns have been resilient for investors who stay the course.