Despite a brand’s intangibility, it’s hard to deny just how effective a strong one can be at boosting a company’s bottom line. With this in mind, Brand Finance takes on the challenge of identifying the world’s most valuable brands in the world in its annual Global 500 Report. The graphic above, using data from the latest edition of the report, highlights the top 100 most valuable brands in 2022. Editor’s note: This ranking measures the value of brands, which can be thought of as marketing-related intangible assets that create a brand identity and reputation in the minds of consumers. It attempts to measure this in financial terms, calculating what the brand is worth to the company that owns it. For more information on methodology, calculations, and sourcing, go to the bottom of this article.
A Full Breakdown of the Most Valuable Brands
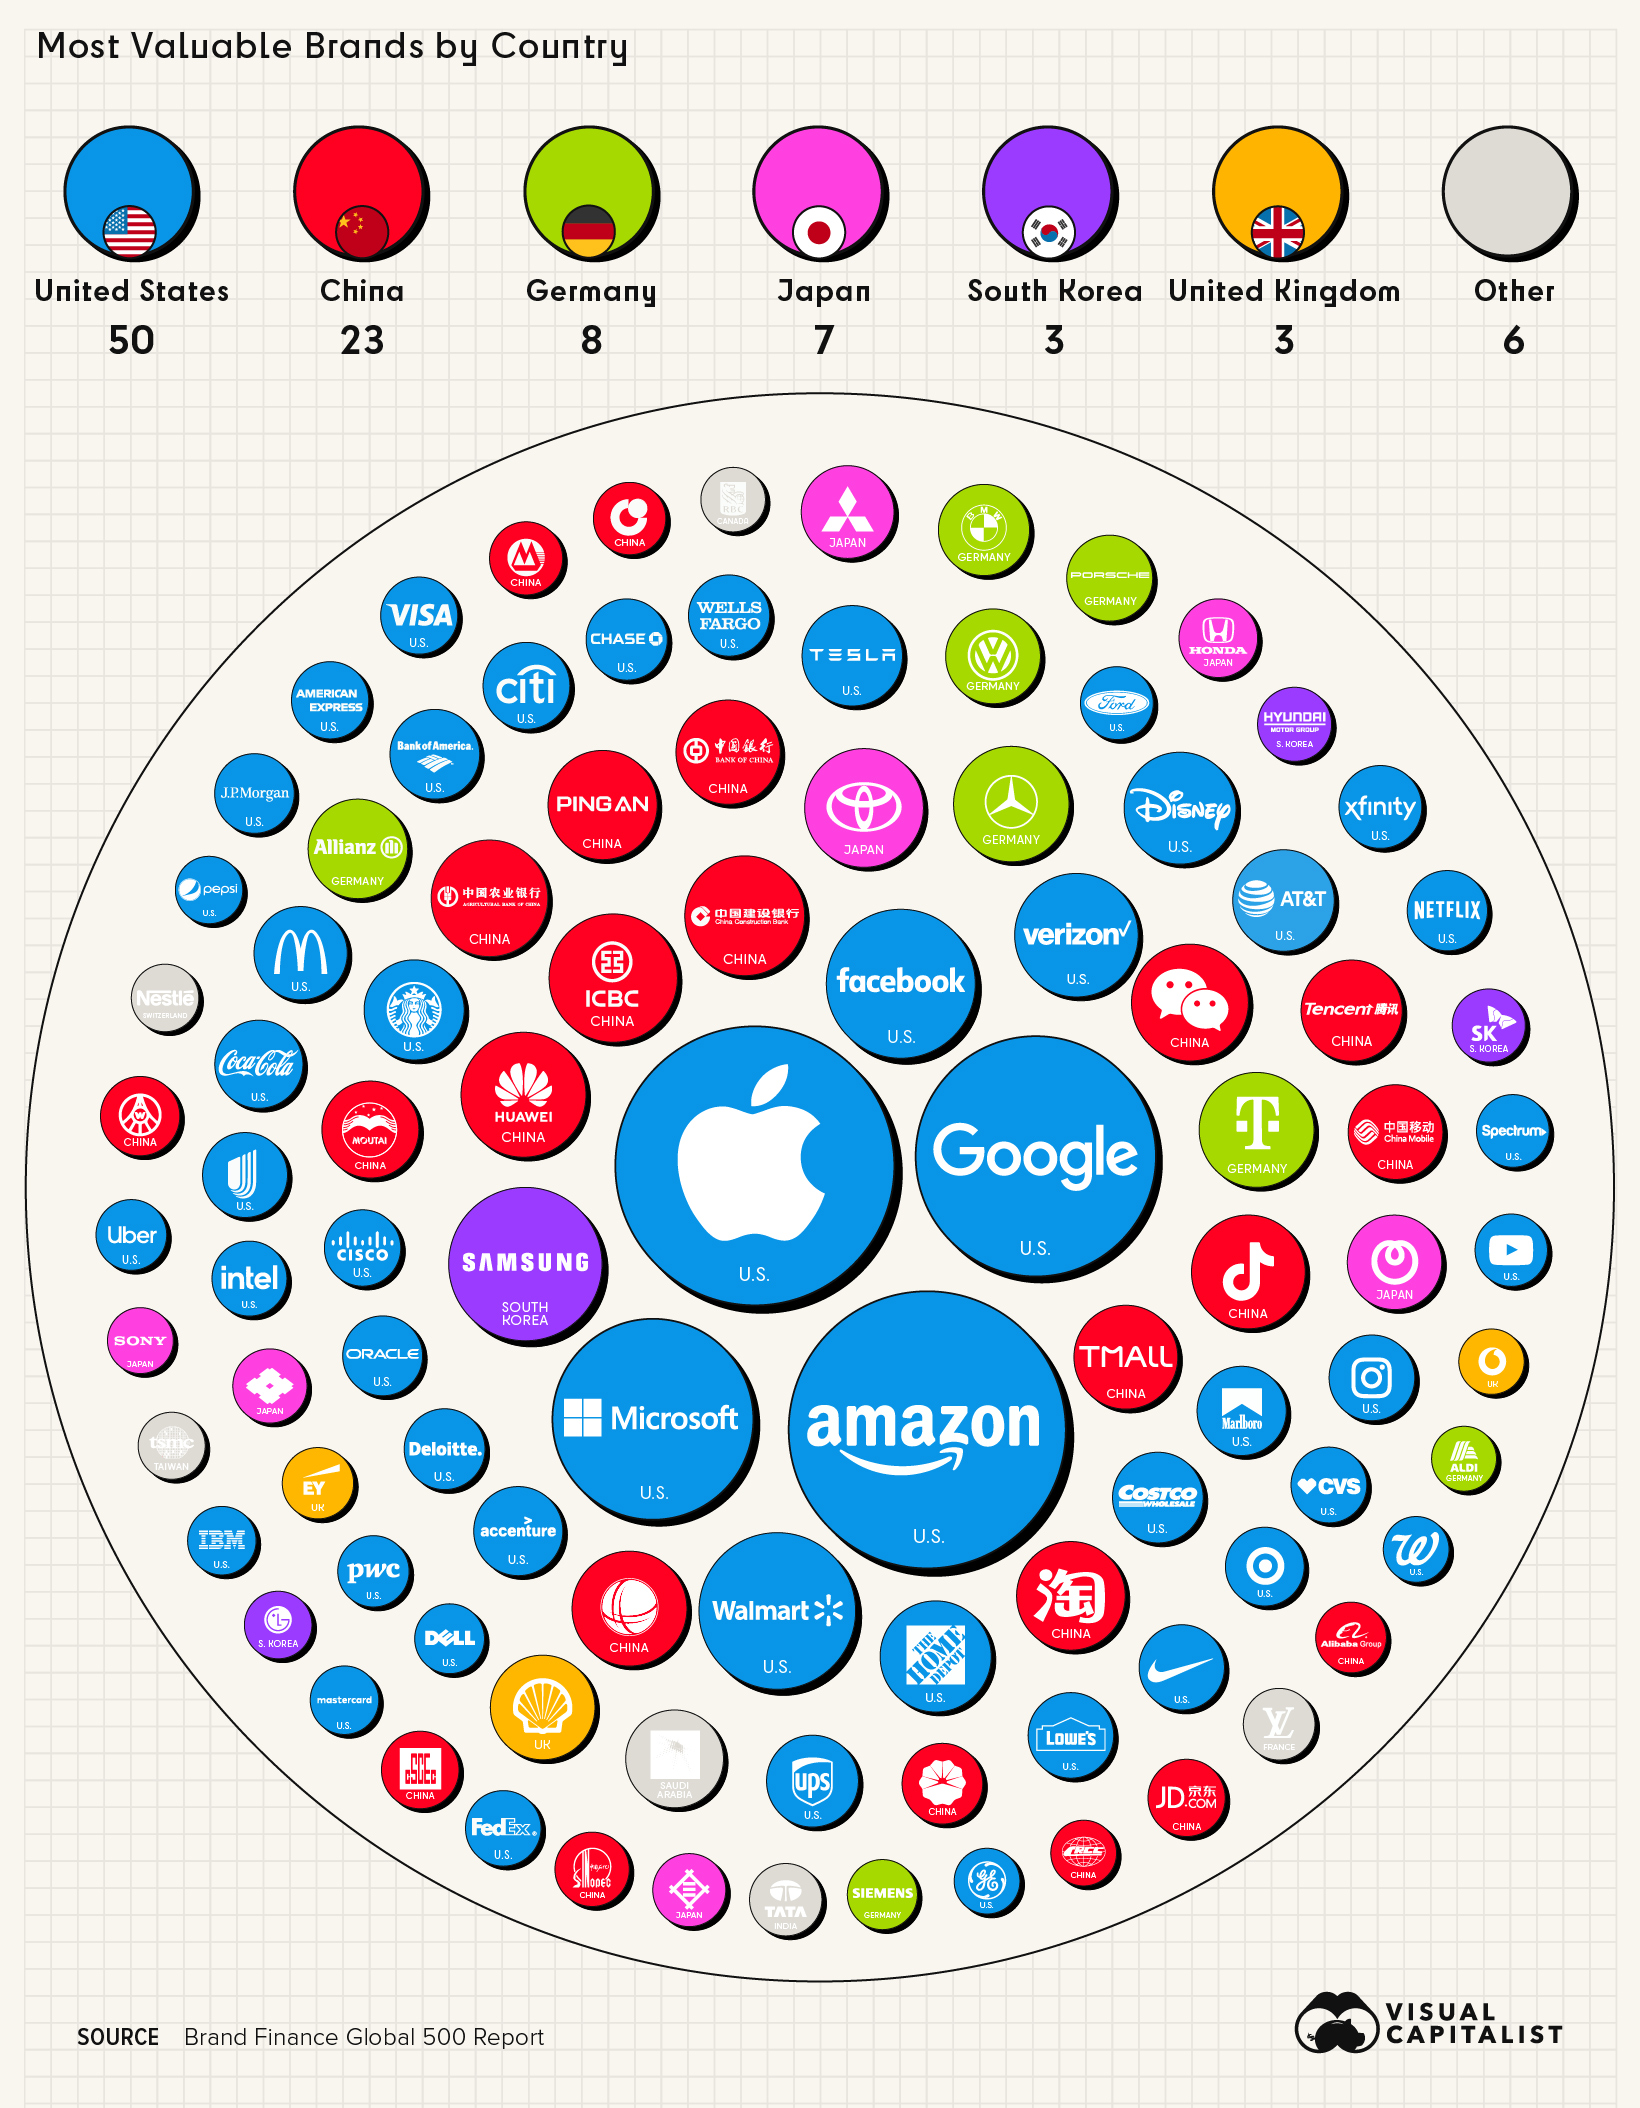
With an increase of 35% since last year’s report, Apple retains its top spot on the ranking as the world’s most valuable brand, with a total brand value of $335.1 billion. This is the highest brand value ever recorded in the history of the Global 500 report, which has been published each year since 2007. As one of the world’s largest tech companies, Apple dominates the smartphone market, especially in the U.S., where more than 50% of operating smartphones are now an iPhone. Here’s a complete list of the 100 most valuable brands according to the report: One other brand worth highlighting is TikTok. The social media company saw a 215% increase in its brand value year-over-year, making it the fastest-growing brand on the entire list. Between 2019 and 2021, the platform saw its userbase skyrocket, growing from 291.4 million to 655.9 million in just two years. If this growth continues, TikTok could reach nearly one billion users by 2025, according to projections from Insider Intelligence.
Most Valuable Sectors
Over a third of the brands on the list fall into the tech and services sector. Combined, this category has a brand value of $2.0 trillion. Media is the second most valuable sector—19% of the top 100 brands fall under the media and telecoms sector, including Google, Facebook, and WeChat. COVID-19 is partly the reason for this, as media consumption increased throughout the global pandemic. For example, in the first nine months of 2021, Snapchat’s daily usage grew by 77%. Despite increased traction with users, it’s worth noting the company is now feeling the sting as the real world competes for attention spans once again and advertisers begin to ghost the app due to recession jitters. As pandemic restrictions fade out around the world, and murmurs of a global recession threaten global economic growth, next year’s report could see some big shifts in brand value.
The Geography of Valuable Brands
When looking at where these brands are based, we see that the United States and China account for 73 of the top 100 brands on the ranking. Even more surprising—just six countries make up 94% of the list. The growth of Chinese companies on the global stage is reflected in this visualization. As a point of comparison, a decade ago, only six Chinese companies made Brand Finance’s Top 100 ranking, and none of them were in the top 30 for brand value.
Interestingly, European countries only make up 14% of the list, which is a testament to just how much Europe’s economic dominance has dwindled over the last few decades. Back in the 1960s, Europe accounted for nearly a third of the world’s total GDP. But by 2017, it had dropped down to 16%. According to a forecast by the Pardee Center of the University of Denver, the EU’s share of global GDP is expected to drop down to 10% by 2100. Of course, if history has taught us anything, it’s that a lot can change over the span of a century. How a ranking like this will look in coming decades is anyone’s guess. Source: Brand Finance Global 500 Report Important note: The values shown above are brand value calculations as opposed to market capitalization. See below for more details. How is brand value calculated? In simple terms, the methodology for calculating “brand value” is a formula that is as follows: Brand Strength (BSI) x Brand Royalty Rate x Brand Revenues = Brand Value Brand Strength Index (BSI) looks at brand investment, brand equity, and brand performance. The brand royalty rate is determined based on sector. Lastly, forecast brand-specific revenues are determined based on the proportion of parent company revenues attributable to the brand in question. Brand value itself is discounted to net present value. We recommend visiting page 94 and 99 of the report to view the full explanation of the methodology. on Last year, stock and bond returns tumbled after the Federal Reserve hiked interest rates at the fastest speed in 40 years. It was the first time in decades that both asset classes posted negative annual investment returns in tandem. Over four decades, this has happened 2.4% of the time across any 12-month rolling period. To look at how various stock and bond asset allocations have performed over history—and their broader correlations—the above graphic charts their best, worst, and average returns, using data from Vanguard.
How Has Asset Allocation Impacted Returns?
Based on data between 1926 and 2019, the table below looks at the spectrum of market returns of different asset allocations:
We can see that a portfolio made entirely of stocks returned 10.3% on average, the highest across all asset allocations. Of course, this came with wider return variance, hitting an annual low of -43% and a high of 54%.
A traditional 60/40 portfolio—which has lost its luster in recent years as low interest rates have led to lower bond returns—saw an average historical return of 8.8%. As interest rates have climbed in recent years, this may widen its appeal once again as bond returns may rise.
Meanwhile, a 100% bond portfolio averaged 5.3% in annual returns over the period. Bonds typically serve as a hedge against portfolio losses thanks to their typically negative historical correlation to stocks.
A Closer Look at Historical Correlations
To understand how 2022 was an outlier in terms of asset correlations we can look at the graphic below:
The last time stocks and bonds moved together in a negative direction was in 1969. At the time, inflation was accelerating and the Fed was hiking interest rates to cool rising costs. In fact, historically, when inflation surges, stocks and bonds have often moved in similar directions. Underscoring this divergence is real interest rate volatility. When real interest rates are a driving force in the market, as we have seen in the last year, it hurts both stock and bond returns. This is because higher interest rates can reduce the future cash flows of these investments. Adding another layer is the level of risk appetite among investors. When the economic outlook is uncertain and interest rate volatility is high, investors are more likely to take risk off their portfolios and demand higher returns for taking on higher risk. This can push down equity and bond prices. On the other hand, if the economic outlook is positive, investors may be willing to take on more risk, in turn potentially boosting equity prices.
Current Investment Returns in Context
Today, financial markets are seeing sharp swings as the ripple effects of higher interest rates are sinking in. For investors, historical data provides insight on long-term asset allocation trends. Over the last century, cycles of high interest rates have come and gone. Both equity and bond investment returns have been resilient for investors who stay the course.