In fact, a country’s reputation—its brand—is arguably one of its most important assets. A strong nation brand has the power to boost tourism, attract and retain talent, and potentially bring in foreign investment. This graphic uses data from Brand Finance’s Nation Brands 2020 report, which attempts to quantify the reputations of different countries around the world. We’ll also dive into the top 10 nation brands, and how their brand value has changed over time.
How is Nation Brand Value Quantified?
While the report provides a full explanation of its methodology, here’s a quick summary of how the scoring system works. First, Brand Finance calculates a country’s Brand Strength Index (BSI) score using three pillars: From there, the BSI score is used to calculate a hypothetical royalty rate, and applied to a country’s GDP. Then, a discount rate is factored in to account for economic risk. Finally, numbers are crunched to provide the “Brand Value” of a country.
The Top 10 Most Valuable Nation Brands
In this year’s report, Brand Finance highlights the impact COVID-19 has had on nation brand values—in 2020, the top 10 nation brands have seen a 14% drop in brand value, on average. Here are the most valuable nation brands of 2020, and their change in value since last year: Despite a 14.5% decrease in value, the U.S. managed to maintain its top position with a nation brand value of $23.7 trillion. Like many other countries, 2020 has been a tough year for America. From recording the most COVID-19 cases and deaths to dealing with a controversial presidential election, the economic powerhouse faced a tremendous amount of international scrutiny this year. Despite all this, the United States remains one of the most successful and dominant economies worldwide—the only close competitor is China, with a nation brand value of $18.8 trillion.
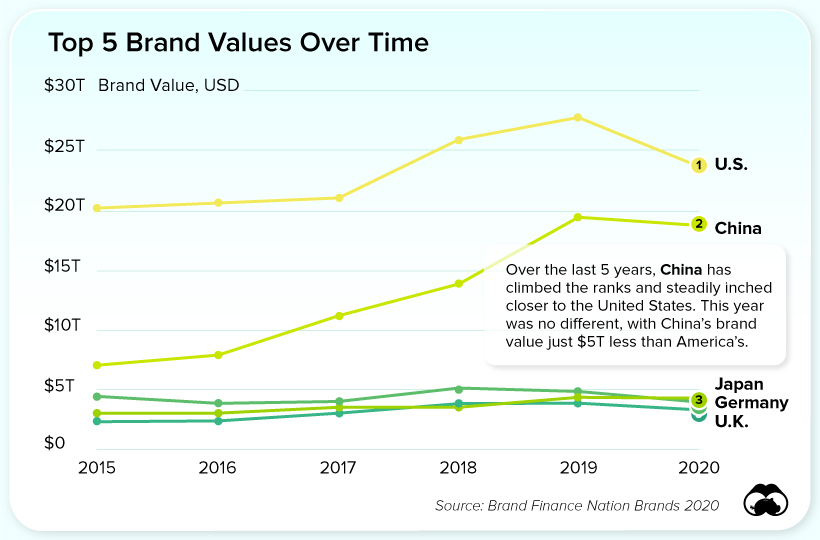
Over the Years: China’s Steady Climb
While China still ranks below the U.S. in total brand value, its percentage decrease from last year was far lower than the other nations on the list. China stayed relatively stable with a modest 4% drop, about 10 percentage points less than the global average. China’s stability this year is nothing new. In fact, the country has been steadily closing the brand value gap between itself and the U.S. since 2015: This year marks the smallest gap yet, with just a $4.9 trillion brand value difference between the U.S. and China. This is significantly lower than in previous years—for instance, in 2015 the U.S. had a $13.1 trillion lead over China. Will America make a comeback in 2021 under a new administration, or will the gap between it and China close even further? on Last year, stock and bond returns tumbled after the Federal Reserve hiked interest rates at the fastest speed in 40 years. It was the first time in decades that both asset classes posted negative annual investment returns in tandem. Over four decades, this has happened 2.4% of the time across any 12-month rolling period. To look at how various stock and bond asset allocations have performed over history—and their broader correlations—the above graphic charts their best, worst, and average returns, using data from Vanguard.
How Has Asset Allocation Impacted Returns?
Based on data between 1926 and 2019, the table below looks at the spectrum of market returns of different asset allocations:
We can see that a portfolio made entirely of stocks returned 10.3% on average, the highest across all asset allocations. Of course, this came with wider return variance, hitting an annual low of -43% and a high of 54%.
A traditional 60/40 portfolio—which has lost its luster in recent years as low interest rates have led to lower bond returns—saw an average historical return of 8.8%. As interest rates have climbed in recent years, this may widen its appeal once again as bond returns may rise.
Meanwhile, a 100% bond portfolio averaged 5.3% in annual returns over the period. Bonds typically serve as a hedge against portfolio losses thanks to their typically negative historical correlation to stocks.
A Closer Look at Historical Correlations
To understand how 2022 was an outlier in terms of asset correlations we can look at the graphic below:
The last time stocks and bonds moved together in a negative direction was in 1969. At the time, inflation was accelerating and the Fed was hiking interest rates to cool rising costs. In fact, historically, when inflation surges, stocks and bonds have often moved in similar directions. Underscoring this divergence is real interest rate volatility. When real interest rates are a driving force in the market, as we have seen in the last year, it hurts both stock and bond returns. This is because higher interest rates can reduce the future cash flows of these investments. Adding another layer is the level of risk appetite among investors. When the economic outlook is uncertain and interest rate volatility is high, investors are more likely to take risk off their portfolios and demand higher returns for taking on higher risk. This can push down equity and bond prices. On the other hand, if the economic outlook is positive, investors may be willing to take on more risk, in turn potentially boosting equity prices.
Current Investment Returns in Context
Today, financial markets are seeing sharp swings as the ripple effects of higher interest rates are sinking in. For investors, historical data provides insight on long-term asset allocation trends. Over the last century, cycles of high interest rates have come and gone. Both equity and bond investment returns have been resilient for investors who stay the course.