In its heyday, Bitcoin had surpassed $10,000 in early December 2017, before briefly crossing the $20,000 mark for a single day on December 17th. A year later, the digital currency had fallen back to Earth, dropping below $3,200. Now that the dust of that wild speculative frenzy has settled, Bitcoin is back on the upswing. What could be causing this most recent surge in growth? We look at four possible explanations for the Bitcoin bull run, as originally outlined by Aaron Hankin at MarketWatch:
Technical Milestones
Bitcoin has seen several technical milestones this year, such as surpassing the psychological barrier of $5,000 in early 2019, breaking the 200-day moving average, and scoring the golden cross (when the 50-day moving average crosses above the 200-day moving average).
Widespread Adoption
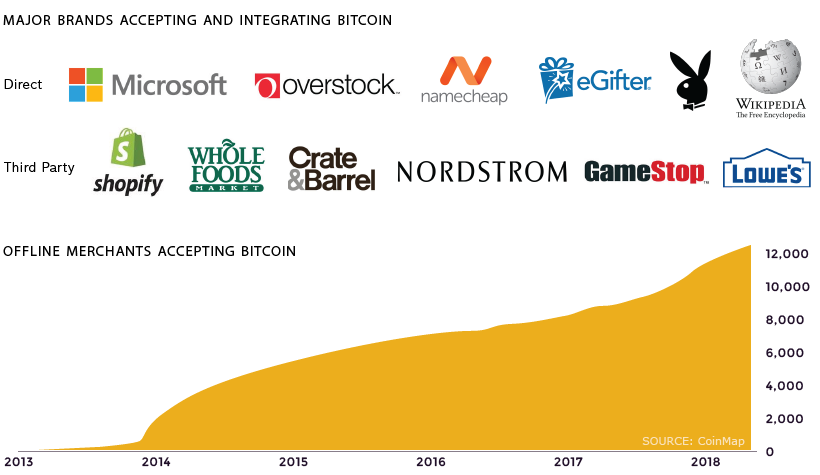
Bitcoin is experiencing a steady increase in adoption across several markets. The term Bitcoin has become a household name — even if people don’t understand what it does, they know what it is.
Shifting Sentiments
Bitcoin has possibly seen a shift in public perception. There have been fewer negative articles about Bitcoin and cryptocurrencies, and the news stories that are negative no longer have as big of an impact as they once did. When Binance announced hackers stole $40 million in bitcoin and when accusations of an $850-million cover-up were leveled against Bitfinex and Tether, the Bitcoin bull run barely flinched and continued to climb.
Wavering Gold Investment
Investor confidence in gold has been more stagnant in recent times. To capitalize on this, Grayscale Investments (of Digital Currency Group) posted a campaign in May 2019 promoting Bitcoin as an ideal alternative to gold because it is borderless, secure, and more efficient for storing value. Despite the World Gold Council’s response denying those claims, the Grayscale Bitcoin Trust saw OTC Markets Group’s highest trading volumes five days later.
Where to from here?
After a long skid, it appears Bitcoin is showing signs of life again. Bitcoin’s price can be highly volatile, so it remains to be seen whether this is the beginning of a bull run, or whether this is just another bump in the roller coaster ride. Editor’s note: The price of Bitcoin has fallen to $7,100 at time of publishing and will likely continue to experience extreme volatility. However, even at a price of $7,100, this is still a 120% increase from lows in Dec 2018. As well, an earlier version of this graphic had incorrect dates on the timeline. That has now been corrected. on Last year, stock and bond returns tumbled after the Federal Reserve hiked interest rates at the fastest speed in 40 years. It was the first time in decades that both asset classes posted negative annual investment returns in tandem. Over four decades, this has happened 2.4% of the time across any 12-month rolling period. To look at how various stock and bond asset allocations have performed over history—and their broader correlations—the above graphic charts their best, worst, and average returns, using data from Vanguard.
How Has Asset Allocation Impacted Returns?
Based on data between 1926 and 2019, the table below looks at the spectrum of market returns of different asset allocations:
We can see that a portfolio made entirely of stocks returned 10.3% on average, the highest across all asset allocations. Of course, this came with wider return variance, hitting an annual low of -43% and a high of 54%.
A traditional 60/40 portfolio—which has lost its luster in recent years as low interest rates have led to lower bond returns—saw an average historical return of 8.8%. As interest rates have climbed in recent years, this may widen its appeal once again as bond returns may rise.
Meanwhile, a 100% bond portfolio averaged 5.3% in annual returns over the period. Bonds typically serve as a hedge against portfolio losses thanks to their typically negative historical correlation to stocks.
A Closer Look at Historical Correlations
To understand how 2022 was an outlier in terms of asset correlations we can look at the graphic below:
The last time stocks and bonds moved together in a negative direction was in 1969. At the time, inflation was accelerating and the Fed was hiking interest rates to cool rising costs. In fact, historically, when inflation surges, stocks and bonds have often moved in similar directions. Underscoring this divergence is real interest rate volatility. When real interest rates are a driving force in the market, as we have seen in the last year, it hurts both stock and bond returns. This is because higher interest rates can reduce the future cash flows of these investments. Adding another layer is the level of risk appetite among investors. When the economic outlook is uncertain and interest rate volatility is high, investors are more likely to take risk off their portfolios and demand higher returns for taking on higher risk. This can push down equity and bond prices. On the other hand, if the economic outlook is positive, investors may be willing to take on more risk, in turn potentially boosting equity prices.
Current Investment Returns in Context
Today, financial markets are seeing sharp swings as the ripple effects of higher interest rates are sinking in. For investors, historical data provides insight on long-term asset allocation trends. Over the last century, cycles of high interest rates have come and gone. Both equity and bond investment returns have been resilient for investors who stay the course.


