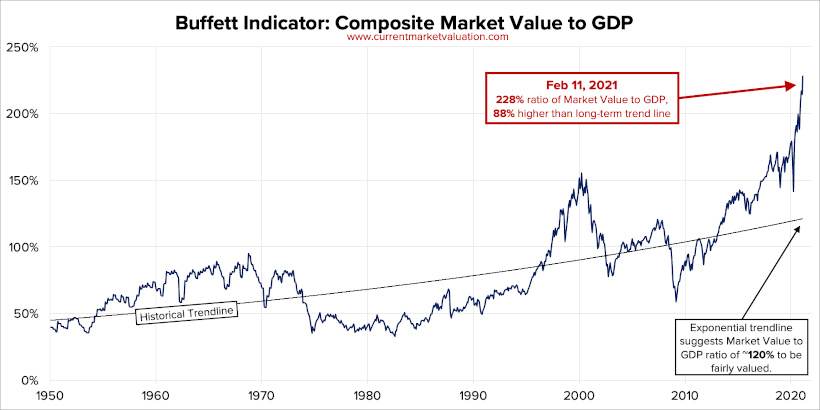
This ratio, now commonly known as the Buffett Indicator, compares the size of the stock market to that of the economy. A high ratio indicates an overvalued market—and as of February 11, 2021, the ratio has reached all-time highs, indicating that the U.S. stock market is currently strongly overvalued. Today’s graphic by Current Market Valuation (CMV) provides an overview of how the Buffett Indicator has changed since 1950. We’ll also explain how the ratio is calculated, and why things might not be as dire as seem.
The Buffet Indicator, Explained
Before diving into the data, let’s cover the basics—what is the Buffett Indicator, and how is its value calculated? The Buffett Indicator is a ratio used by investors to gauge whether the market is undervalued, fair valued, or overvalued. The ratio is measured by dividing the collective value of a country’s stock market by the nation’s GDP.
Measuring Total Value
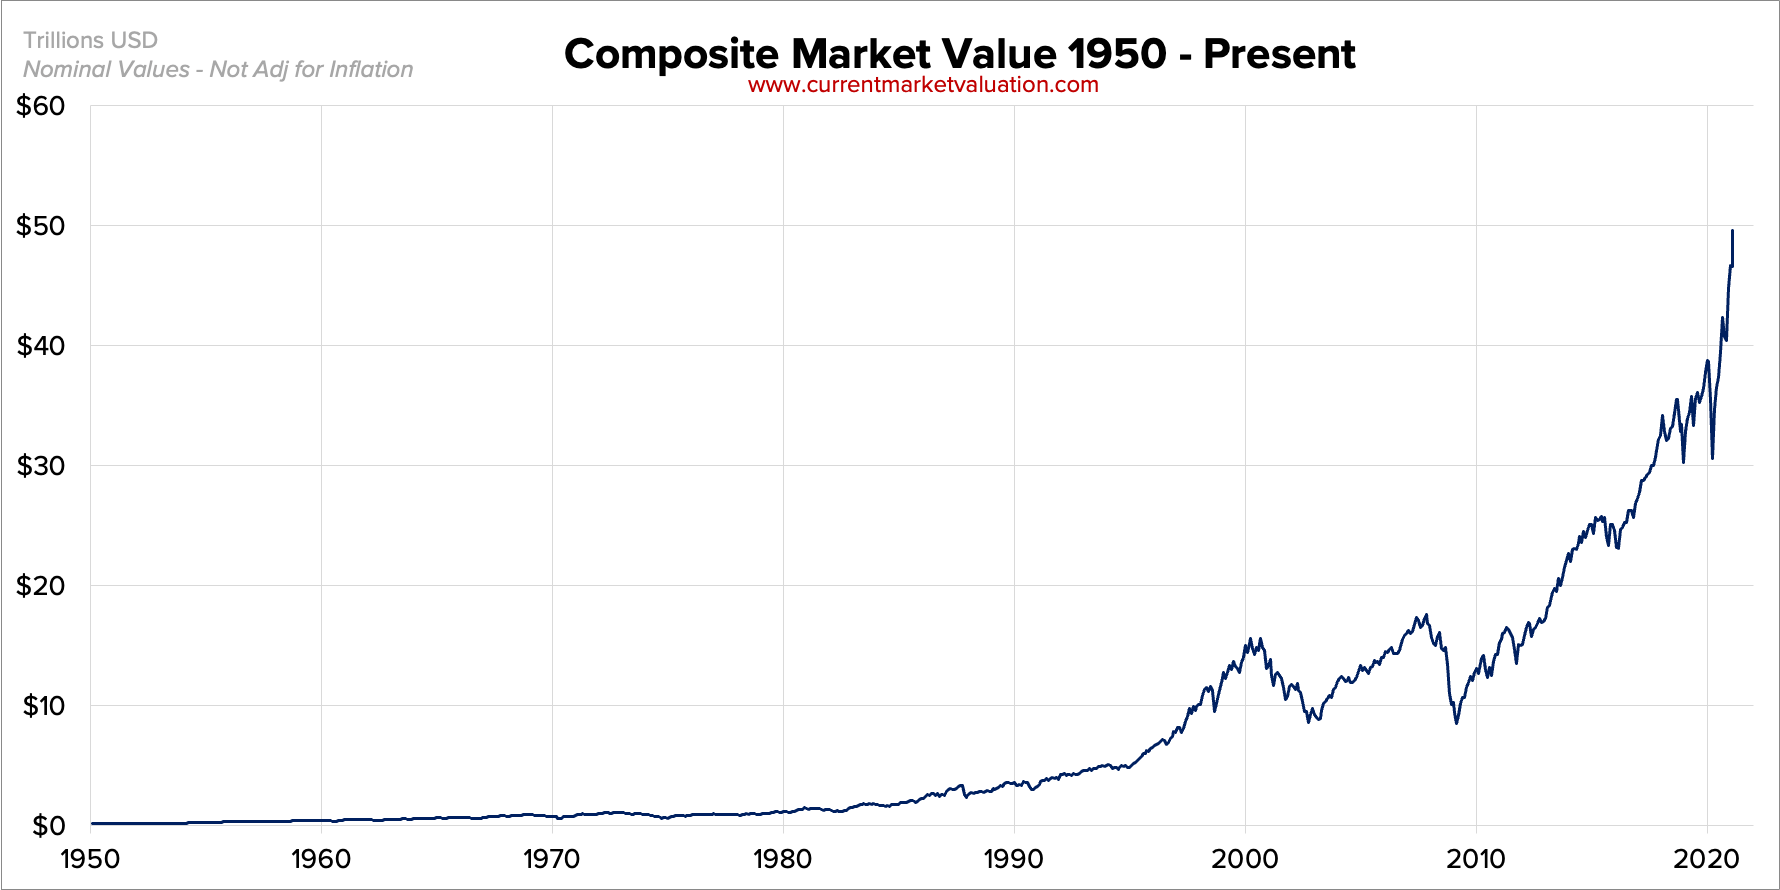
CMV used the Wilshire 5000 index, along with data from the Federal Reserve for the historical component, to measure the collective value of the U.S. stock market. Here’s a look at the nation’s composite market value since 1950:
As the chart indicates, the market has experienced steady growth since 2010. And as of February 11, 2021, its total value sits at $49.5T.
Measuring GDP
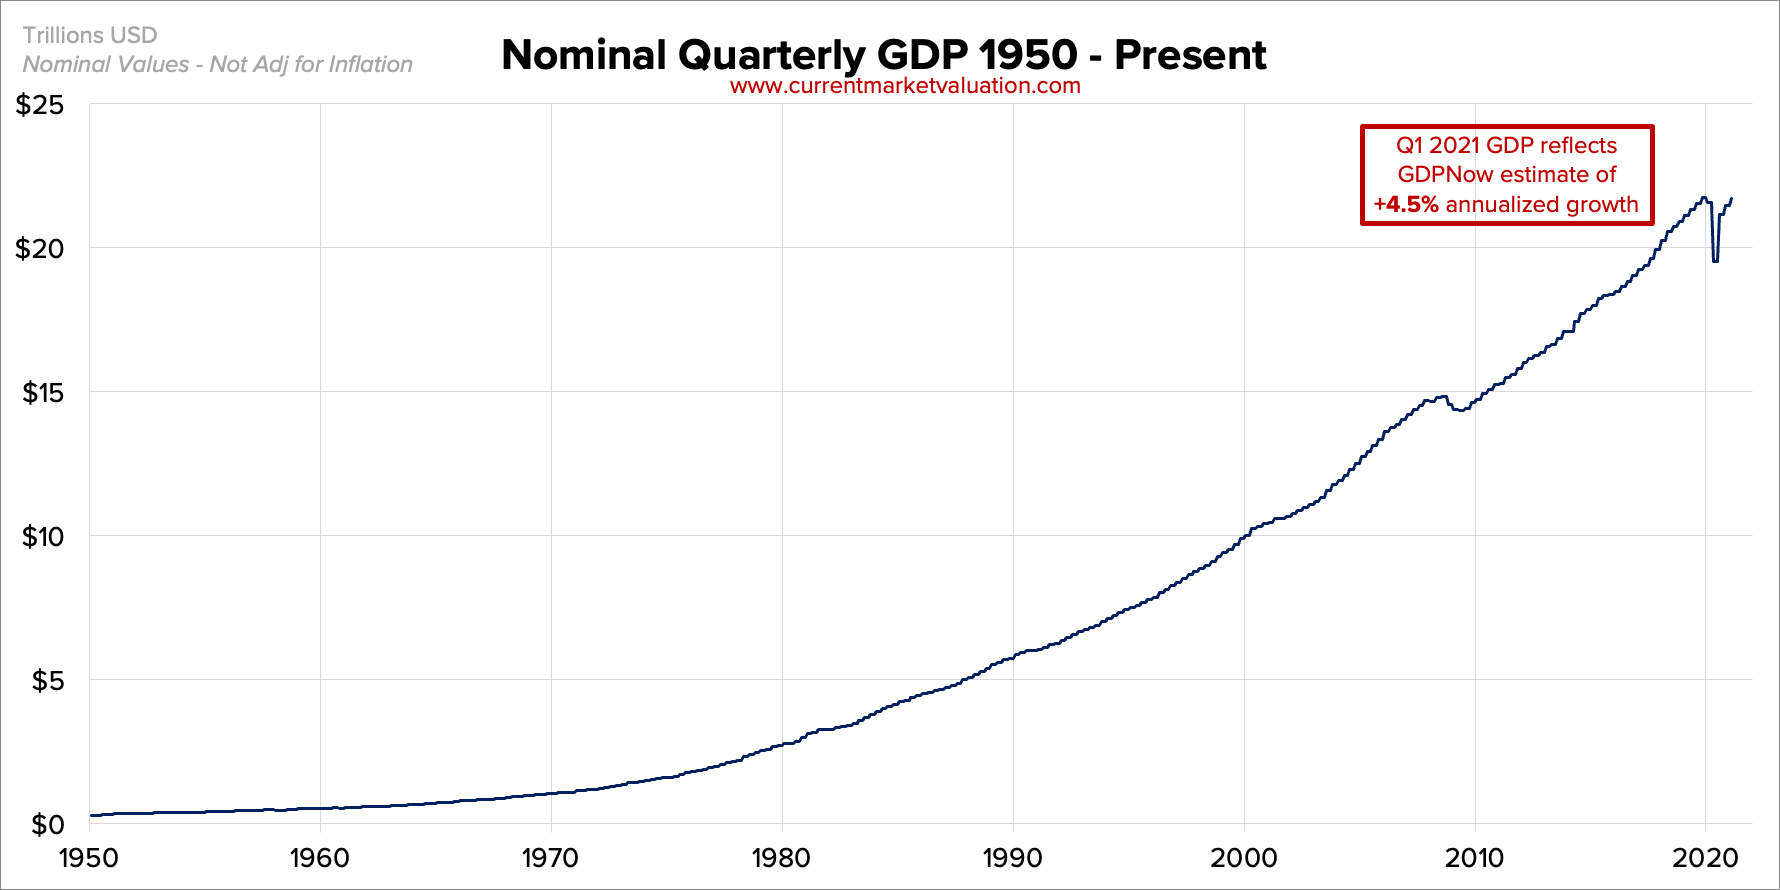
For the data on GDP since 1950, CMV dipped into the archives from the U.S. Government’s Bureau of Economic Analysis:
While the Bureau’s data is published quarterly, it doesn’t provide the latest figures. So to find Q1 2021 GDP, CMV used data from the Federal Reserve Bank of Atlanta, and came up with an annualized GDP of $21.7T.
The Ratio
According to Warren Buffett, “if the ratio approaches 200%…you are playing with fire.”
And with the current U.S. ratio sitting at 228%—about 88% higher than historical averages, it certainly looks like things are heating up.
Will History Repeat Itself?
As the popular investing expression goes, the trend is your friend. And historically, the Buffett Indicator has predicted several of America’s most devastating economic downturns. Here’s a look at some historical moments in the U.S. stock market, and where the Buffett Indicator was valued at the time: As the table shows, the ratio spiked during the Dotcom Bubble, and was relatively high in the months leading up to the 2008 financial crisis. But does that mean we should take the ratio’s current spike as a warning for a market crash in the near future? According to some experts, we might not need to sound the alarms just yet. Why are some investors so confident in the current market? One main factor is low interest rates, which are expected to stay low for the foreseeable future. When interest rates are low, borrowing money becomes cheaper, and future real earnings are theoretically worth more, which can have a positive impact on the stock market. And low interest rates mean smaller returns for low-risk assets like bonds, which lowers investor demand and ultimately boosts stock prices further. Meaning that, as long as interest rates are at record lows, the Buffett Indicator will likely stay high. However, history has been known to repeat itself. So, while we might not need to fasten our seatbelts just yet, this historically high ratio is certainly worth paying attention to. on Last year, stock and bond returns tumbled after the Federal Reserve hiked interest rates at the fastest speed in 40 years. It was the first time in decades that both asset classes posted negative annual investment returns in tandem. Over four decades, this has happened 2.4% of the time across any 12-month rolling period. To look at how various stock and bond asset allocations have performed over history—and their broader correlations—the above graphic charts their best, worst, and average returns, using data from Vanguard.
How Has Asset Allocation Impacted Returns?
Based on data between 1926 and 2019, the table below looks at the spectrum of market returns of different asset allocations:
We can see that a portfolio made entirely of stocks returned 10.3% on average, the highest across all asset allocations. Of course, this came with wider return variance, hitting an annual low of -43% and a high of 54%.
A traditional 60/40 portfolio—which has lost its luster in recent years as low interest rates have led to lower bond returns—saw an average historical return of 8.8%. As interest rates have climbed in recent years, this may widen its appeal once again as bond returns may rise.
Meanwhile, a 100% bond portfolio averaged 5.3% in annual returns over the period. Bonds typically serve as a hedge against portfolio losses thanks to their typically negative historical correlation to stocks.
A Closer Look at Historical Correlations
To understand how 2022 was an outlier in terms of asset correlations we can look at the graphic below:
The last time stocks and bonds moved together in a negative direction was in 1969. At the time, inflation was accelerating and the Fed was hiking interest rates to cool rising costs. In fact, historically, when inflation surges, stocks and bonds have often moved in similar directions. Underscoring this divergence is real interest rate volatility. When real interest rates are a driving force in the market, as we have seen in the last year, it hurts both stock and bond returns. This is because higher interest rates can reduce the future cash flows of these investments. Adding another layer is the level of risk appetite among investors. When the economic outlook is uncertain and interest rate volatility is high, investors are more likely to take risk off their portfolios and demand higher returns for taking on higher risk. This can push down equity and bond prices. On the other hand, if the economic outlook is positive, investors may be willing to take on more risk, in turn potentially boosting equity prices.
Current Investment Returns in Context
Today, financial markets are seeing sharp swings as the ripple effects of higher interest rates are sinking in. For investors, historical data provides insight on long-term asset allocation trends. Over the last century, cycles of high interest rates have come and gone. Both equity and bond investment returns have been resilient for investors who stay the course.