The Wealth Inequality Problem in One Chart
It’s clear that America’s financial and political systems are broken
The Chart of the Week is a weekly Visual Capitalist feature on Fridays. It seems that people don’t agree on much these days, but there is one growing exception to that rule. Across the board, Americans are finding that the “system” isn’t working for most people in its current state. Donald Trump and Bernie Sanders have locked into this sentiment to garner unprecedented support as outsider candidates, and there is an undeniable feeling in the air that something has got to give. Why is there so much conviction that things must change?
The Wealth Inequality Problem
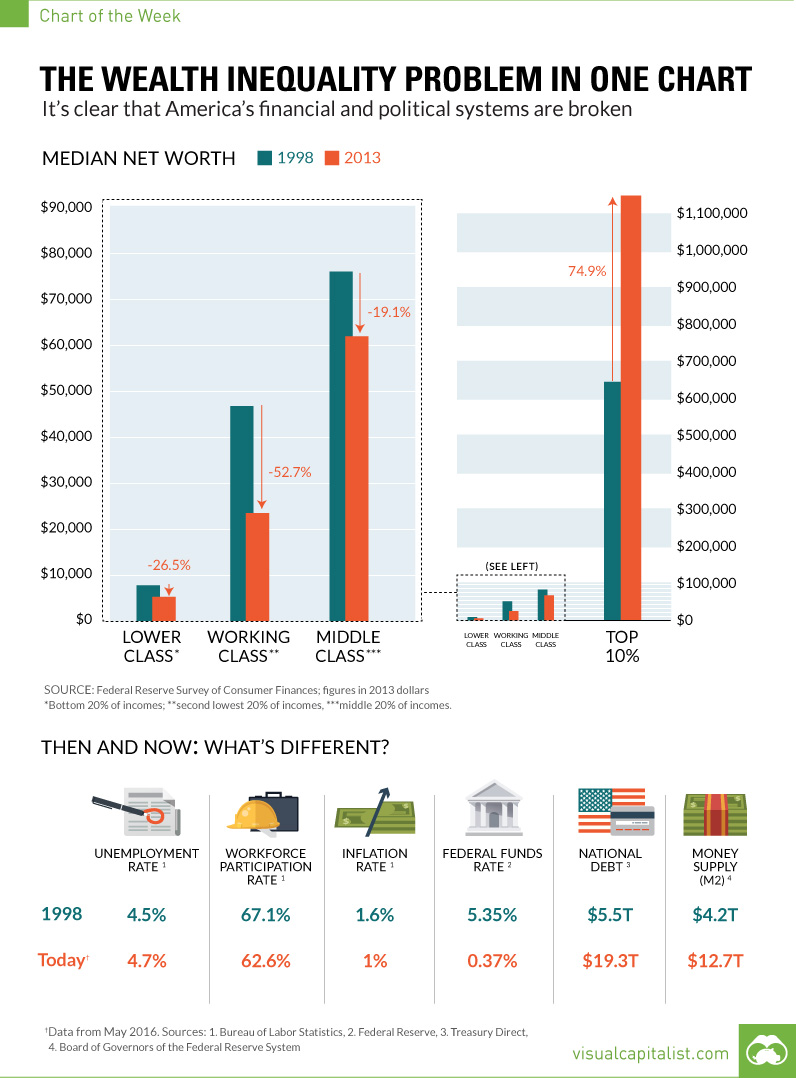
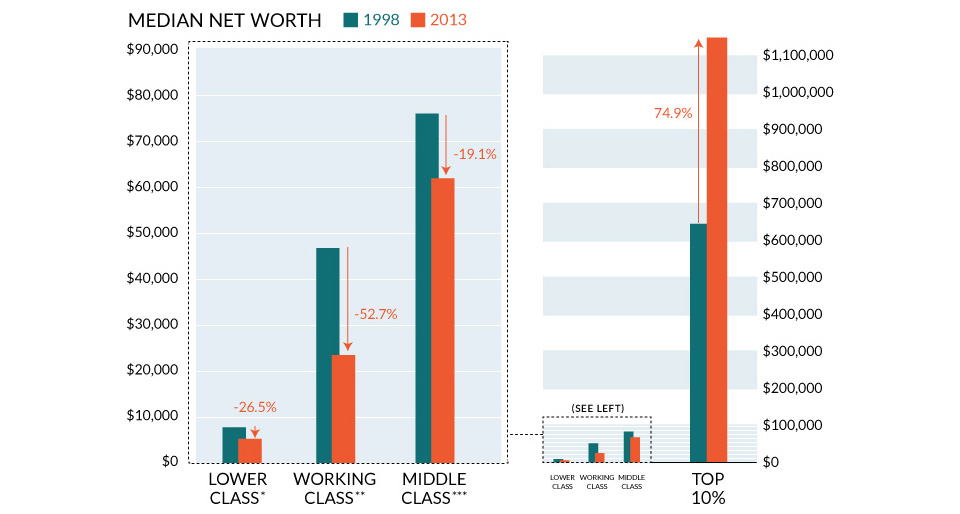
In today’s chart, we showcase the wealth inequality problem in the best way we could. The challenge with it was that literally the data goes “off” the chart with no easy way to show it. On the chart, we plotted the “Median Net Worth” of different wealth groups between 1998 and 2013. This is based on a study that the Federal Reserve does about every three years on consumer finances. When this data is compared in 2013 dollars:
The Lower Class: Wealth has decreased by 26.5% for the bottom 20% of incomes The Working Class: Wealth has decreased by 52.7% for the second lowest 20% of incomes The Middle Class: Wealth has decreased by 19.1% for the middle 20% of incomes
However, one segment has shot up “off” the charts:
The Top 10%: Wealth has increased 74.9%, soaring to a median net worth of over $1.1 million.
Then and Now
What’s changed between then and now? We looked at this from a macroeconomic perspective to get a sense of what has changed between 1998 and today, using latest data from last month (May 2016).
Unemployment is relatively flat between 1998 and today, but the amount of people actively looking for work has dropped by 4.5%. With more workers discouraged since the 2008 crisis, Workforce participation has dropped steadily. Economists also say this is likely due to a rapidly aging population. Inflation has averaged between 0% and 1% over the last three years. It is currently sitting at 1%. In 1998, inflation was closer to the Fed’s 2% target. The Federal Funds Rate, which is the rate that generally acts as a backbone for interest rates across the country, has dropped like a rock. Right now it was effectively 0.37% in May 2016, way down from 5% to 6% that existed for most of the 90s. National Debt has almost quadrupled in nominal terms from $5.5 trillion (1998) to $19.3 trillion today. In real terms, taking into account inflation, it has more than doubled. Money Supply (M2) has increased from $4.2 trillion (1998) to $12.7 trillion today. About $5 trillion of this increase came after the 2008 crisis.
And while there are many factors that go into wealth inequality, we believe that some of the above factors are worth exploring and understanding in detail. For example, who benefits from 0% interest rates the most? Who owns assets like real estate or stocks that have their prices propped up by these policies? Who can borrow capital at low rates to invest or speculate on rises in these prices – is it the people that already have money, or the people without any? Where does all the extra money that is added to the system go? What is each $1 trillion of new U.S. debt spent on, and do the benefits of this added debt outweigh the costs? on The good news is that the Federal Reserve, U.S. Treasury, and Federal Deposit Insurance Corporation are taking action to restore confidence and take the appropriate measures to help provide stability in the market. With this in mind, the above infographic from New York Life Investments looks at the factors that impact bonds, how different types of bonds have historically performed across market environments, and the current bond market volatility in a broader context.
Bond Market Returns
Bonds had a historic year in 2022, posting one of the worst returns ever recorded. As interest rates rose at the fastest pace in 40 years, it pushed bond prices lower due to their inverse relationship. In a rare year, bonds dropped 13%.
Source: FactSet, 01/02/2023.
Bond prices are only one part of a bond’s total return—the other looks at the income a bond provides. As interest rates have increased in the last year, it has driven higher bond yields in 2023.
Source: YCharts, 3/20/2023.
With this recent performance in mind, let’s look at some other key factors that impact the bond market.
Factors Impacting Bond Markets
Interest rates play a central role in bond market dynamics. This is because they affect a bond’s price. When rates are rising, existing bonds with lower rates are less valuable and prices decline. When rates are dropping, existing bonds with higher rates are more valuable and their prices rise. In March, the Federal Reserve raised rates 25 basis points to fall within the 4.75%-5.00% range, a level not seen since September 2007. Here are projections for where the federal funds rate is headed in 2023:
Federal Reserve Projection*: 5.1% Economist Projections**: 5.3%
*Based on median estimates in the March summary of quarterly economic projections.**Projections based on March 10-15 Bloomberg economist survey. Together, interest rates and the macroenvironment can have a positive or negative effect on bonds.
Positive
Here are three variables that may affect bond prices in a positive direction:
Lower Inflation: Reduces likelihood of interest rate hikes. Lower Interest Rates: When rates are falling, bond prices are typically higher. Recession: Can prompt a cut in interest rates, boosting bond prices.
Negative
On the other hand, here are variables that may negatively impact bond prices:
Higher Inflation: Can increase the likelihood of the Federal Reserve to raise interest rates. Rising Interest Rates: Interest rate hikes lead bond prices to fall. Weaker Fundamentals: When a bond’s credit risk gets worse, its price can drop. Credit risk indicates the chance of a default, the risk of a bond issuer not making interest payments within a given time period.
Bonds have been impacted by these negative factors since inflation started rising in March 2021.
Fixed Income Opportunities
Below, we show the types of bonds that have had the best performance during rising rates and recessions.
Source: Derek Horstmeyer, George Mason University 12/3/2022. As we can see, U.S. ultrashort bonds performed the best during rising rates. Mortgage bonds outperformed during recessions, averaging 11.4% returns, but with higher volatility. U.S. long-term bonds had 7.7% average returns, the best across all market conditions. In fact, they were also a close second during recessions. When rates are rising, ultrashort bonds allow investors to capture higher rates when they mature, often with lower historical volatility.
A Closer Look at Bond Market Volatility
While bond market volatility has jumped this year, current dislocations may provide investment opportunities. Bond dislocations allow investors to buy at lower prices, factoring in that the fundamental quality of the bond remains strong. With this in mind, here are two areas of the bond market that may provide opportunities for investors:
Investment-Grade Corporate Bonds: Higher credit quality makes them potentially less vulnerable to increasing interest rates. Intermediate Bonds (2-10 Years): Allow investors to lock in higher rates.
Both types of bonds focus on quality and capturing higher yields when faced with challenging market conditions.
Finding the Upside
Much of the volatility seen in the banking sector was due to banks buying bonds during the pandemic—or even earlier—at a time when interest rates were historically low. Since then, rates have climbed considerably. Should rates moderate or stop increasing, this may present better market conditions for bonds. In this way, today’s steep discount in bond markets may present an attractive opportunity for price appreciation. At the same time, investors can potentially lock in strong yields as inflation may subside in the coming years ahead. Learn more about bond investing strategies with New York Life Investments.