The recent gains can be attributed to a surge in Microsoft’s stock price, after the tech company surprised the market by winning a $10 billion cloud contract from the Pentagon. This also pushed Gates past fellow Seattle billionaire Jeff Bezos, who currently holds a $108.7 billion fortune. With these numbers topping a hundred billion dollars, they can be difficult to comprehend. Luckily for us, Twitter user @betty__cam put together a short animation that simplifies things.
$110 Billion, Visualized
The following one minute animation starts with the median household wealth in the United States of $61,937, working its way up to the Bill Gates fortune of $110 billion:
Along the way, the animation points out comparable dollar amounts to put things in perspective. This includes the amount that people should save for retirement ($1.33 million), Katy Perry’s mansion in Beverly Hills ($19 million), settlements paid by the NYPD in a year ($230 million), and even the wealth of Elon Musk ($27.1 billion).
Millions vs. Billions
Part of the impact of the animation comes as it flips from millions to billions of dollars. For example, the retirement figure of $1.33 million is clearly a solid chunk of money — but when that turns into a tiny speck in contrast to $1 billion, it’s evident that we’re talking about very different scales. This is also illustrated when we look at seconds:
1 million seconds = 11.5 days 1 billion seconds = 31.71 years 110 billion seconds = 3,488.1 years
Go back a million seconds in time, and we’re talking about last week — go back Bill Gates’ wealth in seconds, and you’ll be hanging out with the Ancient Babylonians.
The Equities Effect
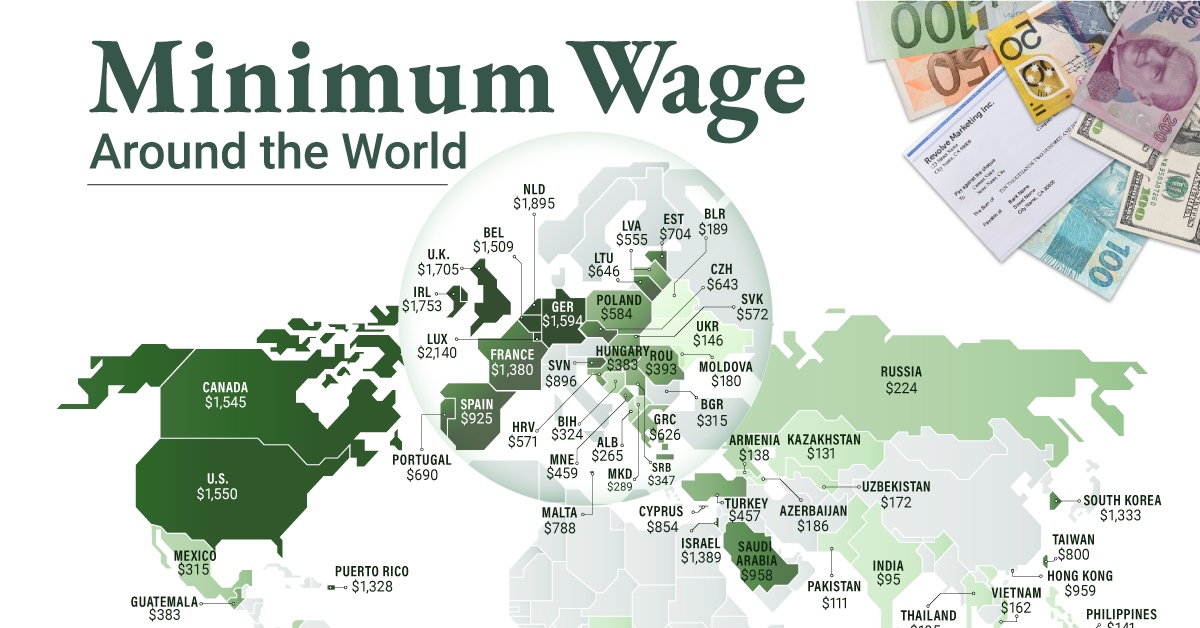
The short animation helps put this immense amount of wealth in perspective, but it also has raises a fair question: why is Bill Gates’ net worth growing if he signed The Giving Pledge, a commitment to give away at least half of his net worth to philanthropic causes? The disconnect lies in the fact that fluctuations in Gates’ net worth are largely connected to the movement of Microsoft’s stock price, as well as the stock market in general. Even though he’s no longer an active officer of the tech giant, Gates still owns close to 1% of outstanding shares — and with Satya Nadella at the helm, Microsoft’s market capitalization has soared to a record-setting $1.15 trillion. Gates also has over 60% of his assets invested in the stock market, which sits at all-time highs as well. For the above reasons, Bill Gates gave away $35 billion in wealth in 2019, but still ended up gaining $16 billion in overall net worth. on To see how the minimum wage differs around the world, we’ve visualized data from Picodi, which includes values for 67 countries as of January 2023.
Monthly Minimum Wage, by Country
The following table includes all of the data used in this infographic. Each value represents the monthly minimum wage a full-time worker would receive in each country. Picodi states that these figures are net of taxes and have been converted to USD. Generally speaking, developed countries have a higher cost of living, and thus require a higher minimum wage. Two outliers in this dataset are Argentina and Turkey, which have increased their minimum wages by 100% or more from January 2022 levels. Turkey is suffering from an ongoing currency crisis, with the lira losing over 40% of its value in 2021. Prices of basic goods have increased considerably as the Turkish lira continues to plummet. In fact, a 2022 survey found that 70% of people in Turkey were struggling to pay for food. Argentina, South America’s second-biggest economy, is also suffering from very high inflation. In response, the country announced three minimum wage increases throughout 2022.
Minimum Wage in the U.S.
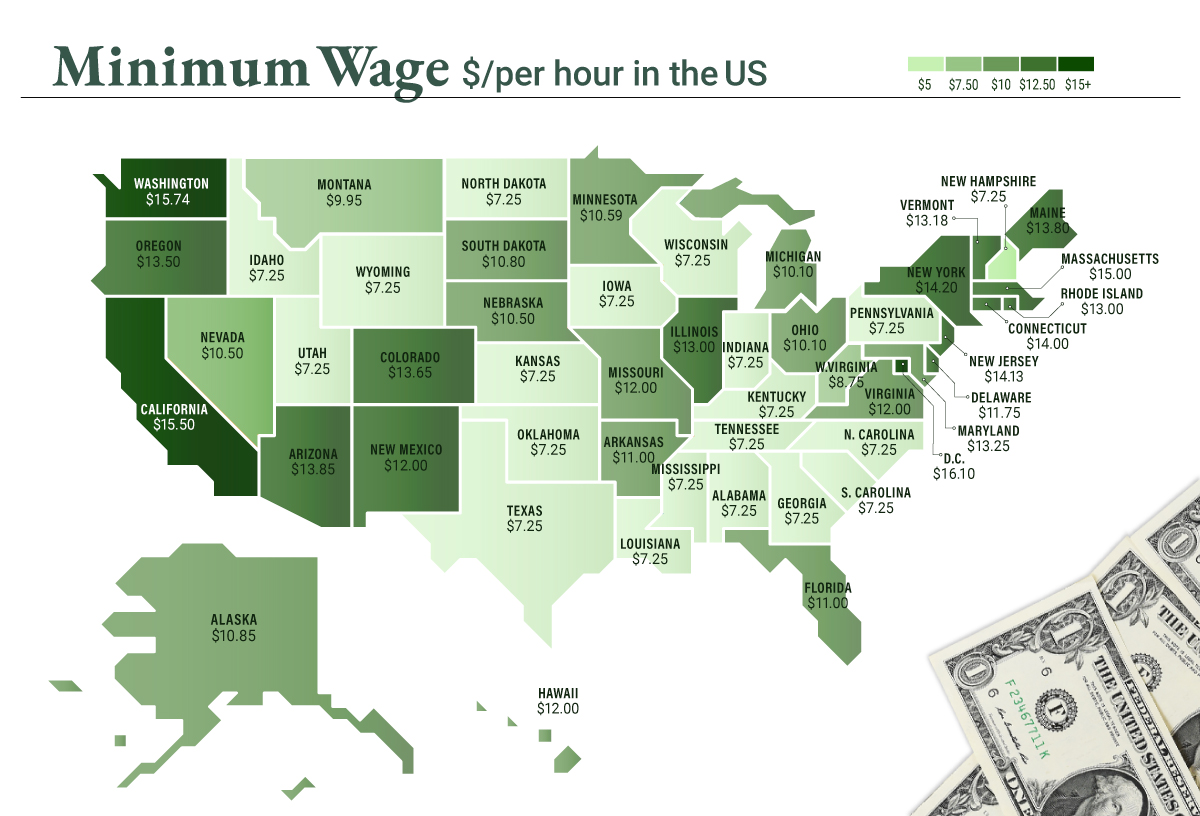
Within the U.S., minimum wage varies significantly by state. We’ve visualized each state’s basic minimum rate (hourly) using January 2023 data from the U.S. Department of Labor.
2023-03-17 Update: This map was updated to fix several incorrect values. We apologize for any confusion this may have caused. America’s federal minimum wage has remained unchanged since 2009 at $7.25 per hour. Each state is allowed to set their own minimum wage, as long as it’s higher than the federal minimum. In states that do not set their own minimum, the federal minimum applies. If we assume someone works 40 hours a week, the federal minimum wage of $7.25 translates to an annual figure of just $15,080 before taxes. California’s minimum wage of $15.50 translates to $32,240 before taxes. For further perspective, check out our 2022 infographic on the salary needed to buy a home across 50 U.S. cities.


