Spending on digital media surpassed television ads in 2017, and now global digital spend is anticipated to top $333 billion this year. As a result, today’s entrepreneurs and small businesses are starting to think about marketing in almost exclusively digital terms – and to have a successful online strategy, it’s important to see the data on what tactics are actually working.
Visualizing 100+ Marketing Stats
Today’s infographic comes to us from Serpwatch and it highlights seven of the most important digital marketing trends to keep an eye on this year. Along the way, it highlights over 100 useful marketing stats that help to reveal the strategies and tactics that maximize ROI in the online arena.
It’s well known that digital media tactics – such as using social media, SEO, search, email, and content marketing – all offer unprecedented levels of analytics, customization, and segmentation for the modern marketer. However, with so much to think about when using these techniques online and at scale, they can also be quite overwhelming. Luckily, the above list provides some marketing stats that stand out in potentially helping businesses make the most out of their digital campaigns.
Stats That Stand Out
Here are some of the marketing stats from the above list that we thought stood out the most, for each category:
Search: The top five search results for a keyword on Google get 70% of the clicks. Social media: 80% of B2B leads come in through LinkedIn vs. 13% on Twitter and 7% on Facebook. Video marketing: Video will represent 82% of all internet traffic by 2021. Cold email marketing: Emails sent between 10-11am have the highest open rates. Tuesday is the best day to send cold emails. Paid advertising: The mobile ad blocking rate has increased 90% year-over-year. Lead generation: 61% of marketers say generating traffic and leads is their top challenge. Content marketing: 47% of buyers viewed 3-5 pieces of content before engaging with a sales rep.
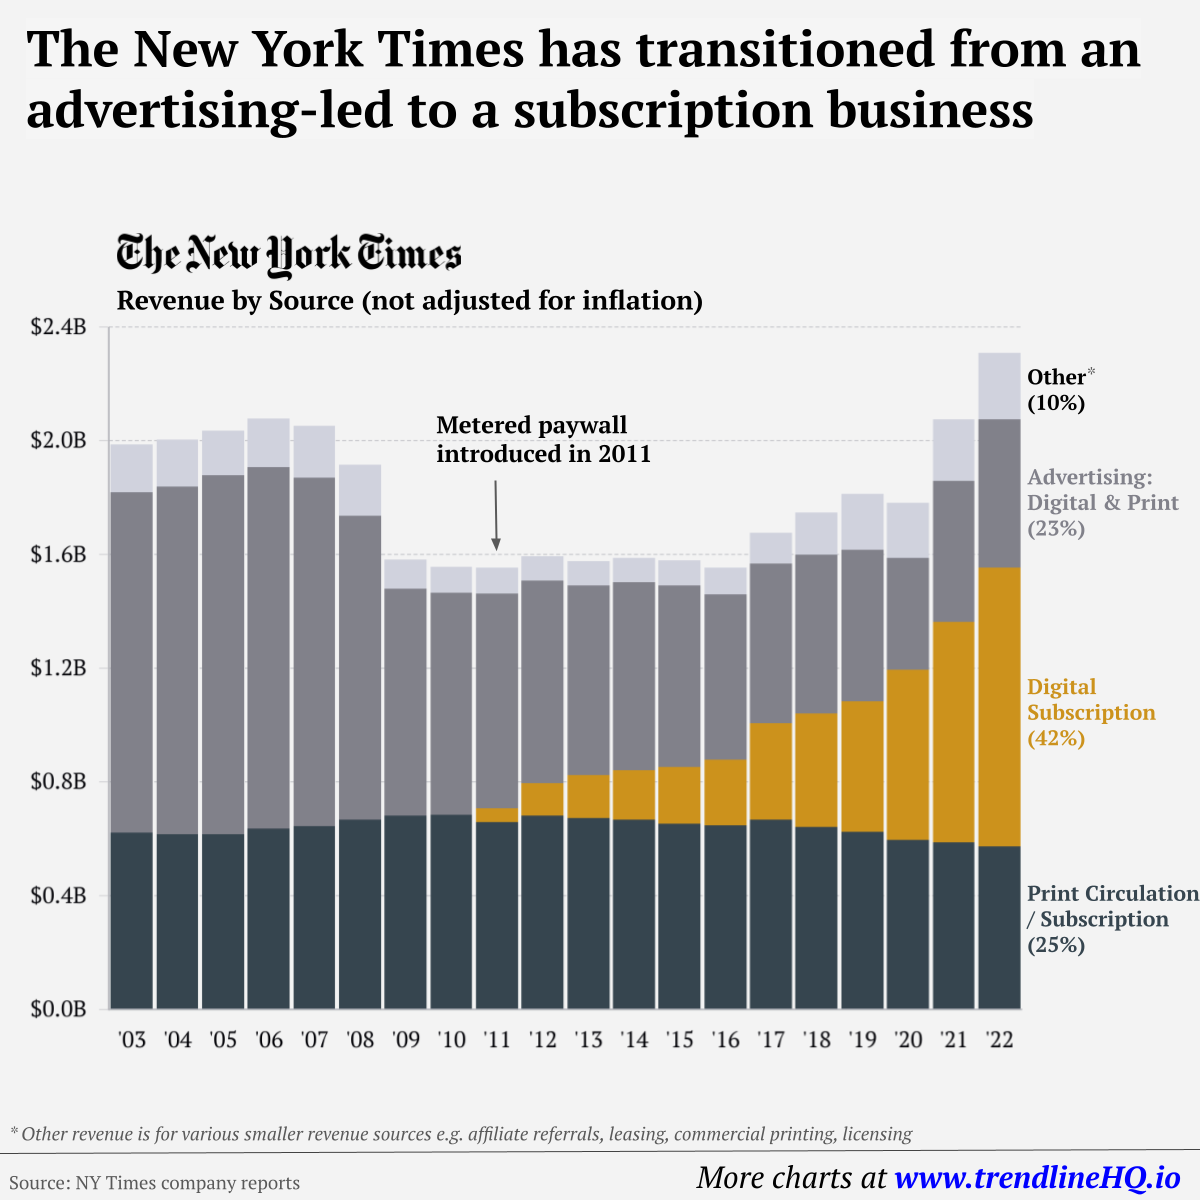
Although the digital marketing space is vast, the useful statistics above may help create some clarity for marketers trying to get the most out of their efforts in 2019 and beyond. on Similar to the the precedent set by the music industry, many news outlets have also been figuring out how to transition into a paid digital monetization model. Over the past decade or so, The New York Times (NY Times)—one of the world’s most iconic and widely read news organizations—has been transforming its revenue model to fit this trend. This chart from creator Trendline uses annual reports from the The New York Times Company to visualize how this seemingly simple transition helped the organization adapt to the digital era.
The New York Times’ Revenue Transition
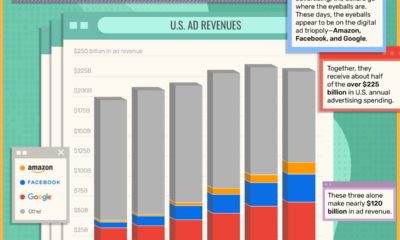
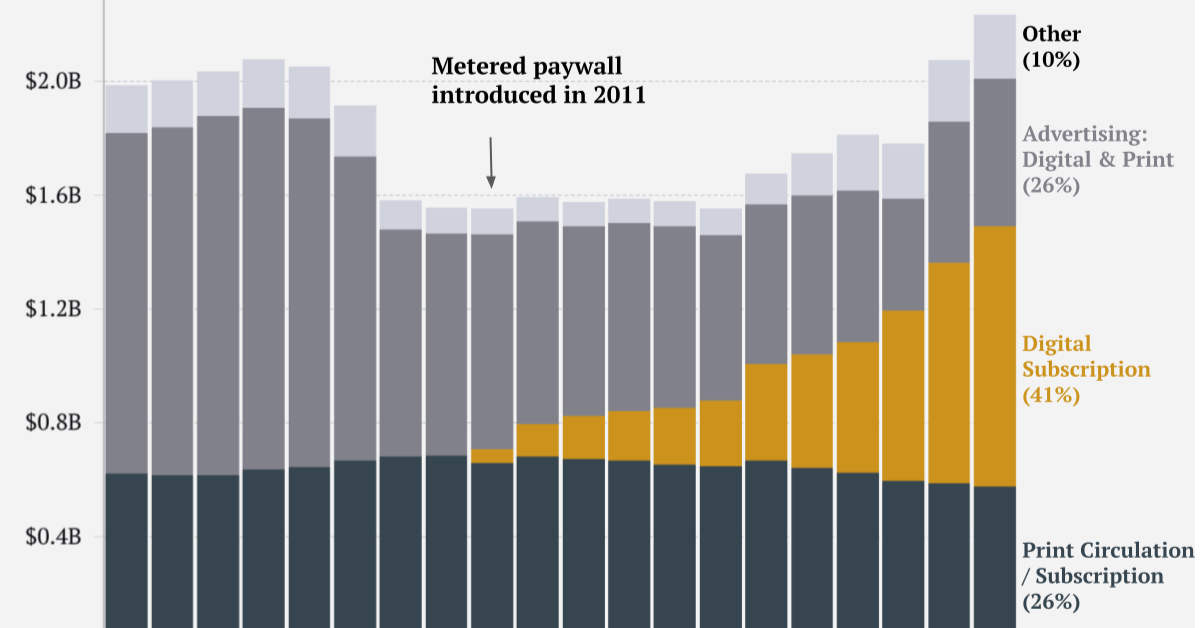
The NY Times has always been one of the world’s most-widely circulated papers. Before the launch of its digital subscription model, it earned half its revenue from print and online advertisements. The rest of its income came in through circulation and other avenues including licensing, referrals, commercial printing, events, and so on. But after annual revenues dropped by more than $500 million from 2006 to 2010, something had to change. In 2011, the NY Times launched its new digital subscription model and put some of its online articles behind a paywall. It bet that consumers would be willing to pay for quality content. And while it faced a rocky start, with revenue through print circulation and advertising slowly dwindling and some consumers frustrated that once-available content was now paywalled, its income through digital subscriptions began to climb. After digital subscription revenues first launched in 2011, they totaled to $47 million of revenue in their first year. By 2022 they had climbed to $979 million and accounted for 42% of total revenue.
Why Are Readers Paying for News?
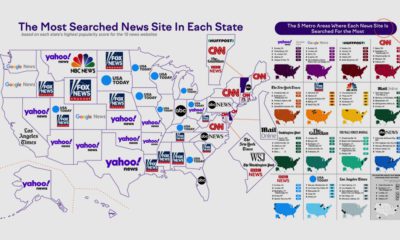
More than half of U.S. adults subscribe to the news in some format. That (perhaps surprisingly) includes around four out of 10 adults under the age of 35. One of the main reasons cited for this was the consistency of publications in covering a variety of news topics. And given the NY Times’ popularity, it’s no surprise that it recently ranked as the most popular news subscription.