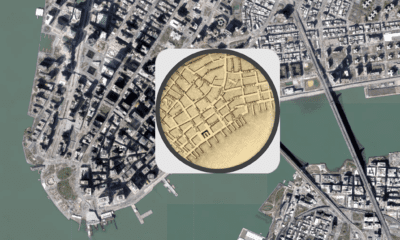
Dividing these population clusters into a coherent framework of statistical areas is no small feat, and the U.S. Census Bureau’s latest map shows just how complex of a task it is. This enormous map—which covers the entire country, including Puerto Rico—includes 392 metropolitan statistical areas and 547 micropolitan statistical areas. For reference, here are all the current metropolitan statistical areas in the United States, organized by population:
From Metro to Micro
The wide variety of population patterns around the country can make it tricky to divide regions up into uniform units. There are two main divisions to consider when viewing this map: One thing to note about all of these definitions is that the cities in these regions must have significant ties to a neighboring region—usually in the form of commuting ties. This is what warrants binding adjacent counties into a measurable area. Another unique layer of data on this map is the shading that indicates the actual urbanized area within metro areas. In the example of Atlanta-Sandy Springs-Alpharetta, it’s easy to see how urban sprawl has expanded the urban area into a number of neighboring counties. With this context in mind, we’ll take a closer look at three points of interest on the map that show this concept at work with varying degrees of complexity.
Level One: The Central City
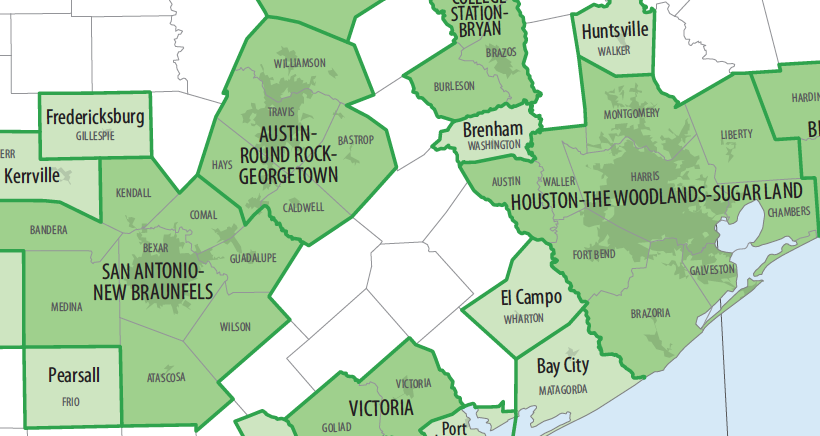
The Texas Triangle offers what is perhaps the most straightforward example of metro areas.
As seen above, Houston, Austin, and San Antonio anchor their respective regions, and surrounding counties are bundled into a metro area. The surrounding counties have all been identified as having ties to the central county, and, in some cases, the urban area has spread into the neighboring county over time.
Level Two: The City Cluster
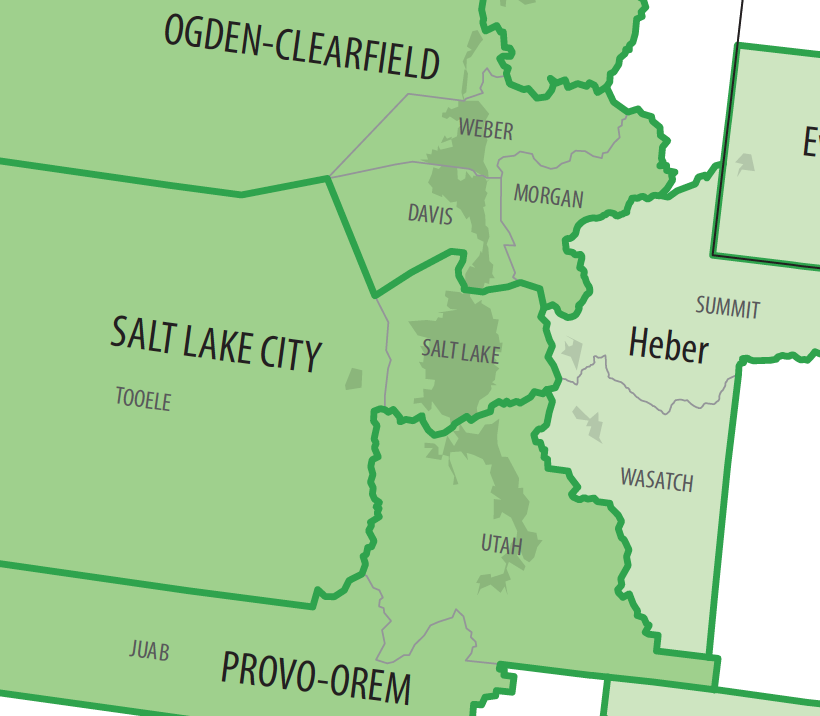
The region anchored by Salt Lake City requires more thought to divide into statistical areas.
While there are a number of population centers in the area, including Salt Lake City, Provo, and Ogden, they all have enough of an economic “magnetic pull” to warrant splitting the region into distinct statistical areas. Of course, regions are always evolving, and occasionally these areas are updated. Salt Lake City and Ogden were previously combined into a single metro area, but were separated in 2005.
Level Three: The Megaregion
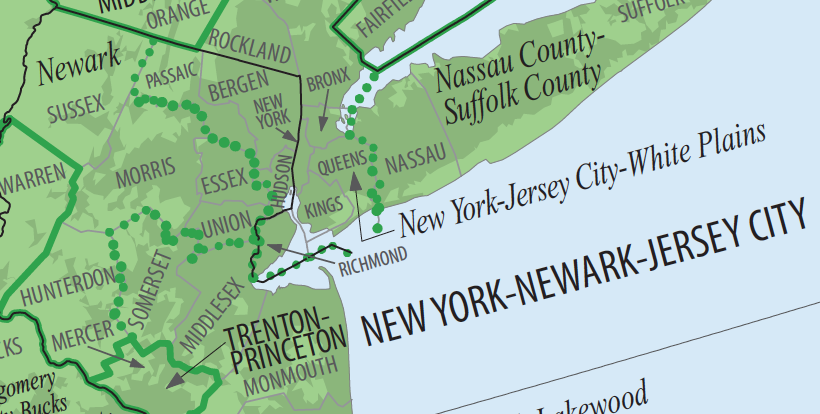
New York City is the ultimate challenge for planners looking to categorize population centers into a neat and tidy statistical box. For one, the contiguous urban area is massive, stretching from the west side of Long Island out to the east side of New Jersey. In addition to New York City itself, the metro area includes 19 other municipalities with over 100,000 people. Next, NYC is an unparalleled economic magnet. Measuring commuting activity is a challenge because a wide variety of people visit the city for so many different reasons. The interconnectedness of the Northeast Megaregion also adds to the complexity.
New York-Newark-Jersey City is such a big pie to carve up, that four of the country’s 11 metro divisions (as indicated by the italicized text and dotted lines) occur in this one area.
Blurring the Lines
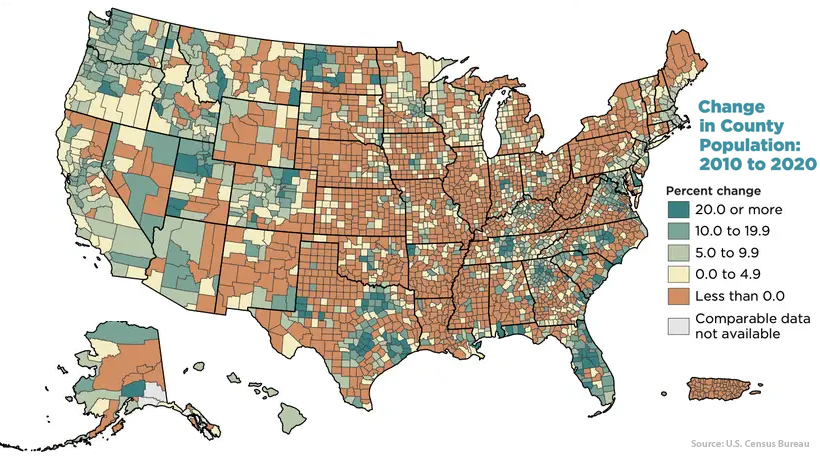
Population patterns are constantly changing across the country, so the next version of this map may have a number of changes on it. Our “straightforward” Texas Triangle example may become tougher to divide up as the population boom continues in the region. Here’s how the population of U.S. countries changed over the past decade:
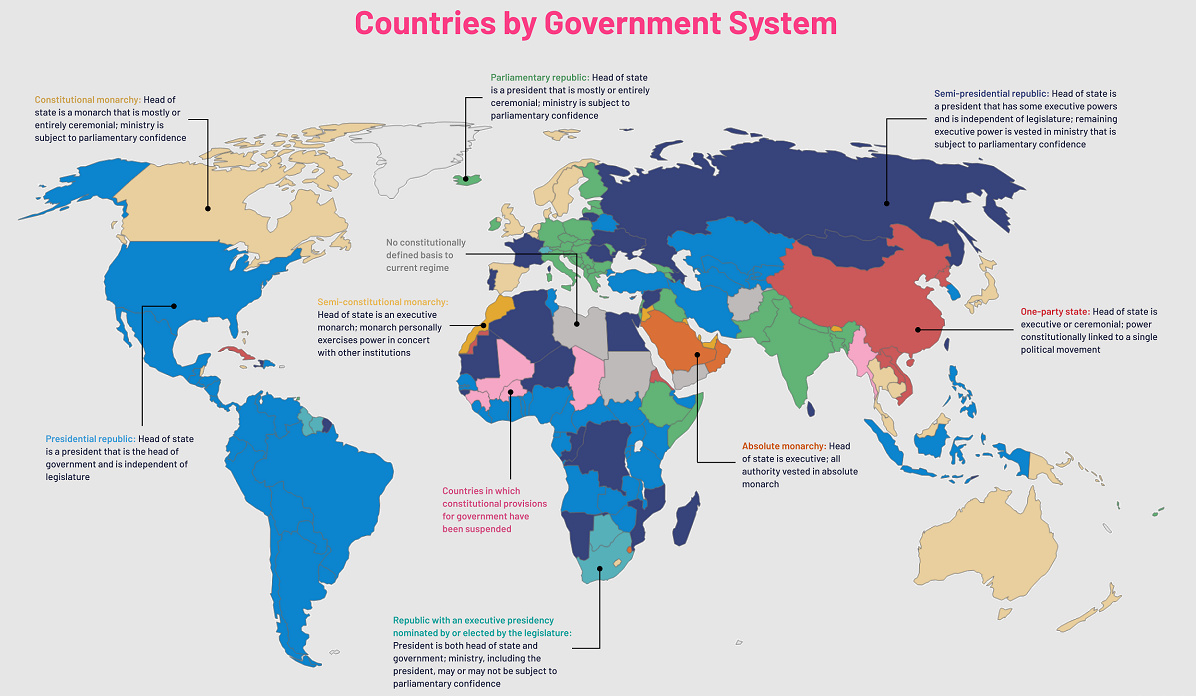
Further complicating matters is the rapid move to remote work and distributed teams. A key element of these census divisions are commuting ties. With work increasingly not bound by geographic limitations, it remains unclear how that trend will impact this type of statistical exercise in the future. on Even while political regimes across these countries have changed over time, they’ve largely followed a few different types of governance. Today, every country can ultimately be classified into just nine broad forms of government systems. This map by Truman Du uses information from Wikipedia to map the government systems that rule the world today.
Countries By Type of Government
It’s important to note that this map charts government systems according to each country’s legal framework. Many countries have constitutions stating their de jure or legally recognized system of government, but their de facto or realized form of governance may be quite different. Here is a list of the stated government system of UN member states and observers as of January 2023: Let’s take a closer look at some of these systems.
Monarchies
Brought back into the spotlight after the death of Queen Elizabeth II of England in September 2022, this form of government has a single ruler. They carry titles from king and queen to sultan or emperor, and their government systems can be further divided into three modern types: constitutional, semi-constitutional, and absolute. A constitutional monarchy sees the monarch act as head of state within the parameters of a constitution, giving them little to no real power. For example, King Charles III is the head of 15 Commonwealth nations including Canada and Australia. However, each has their own head of government. On the other hand, a semi-constitutional monarchy lets the monarch or ruling royal family retain substantial political powers, as is the case in Jordan and Morocco. However, their monarchs still rule the country according to a democratic constitution and in concert with other institutions. Finally, an absolute monarchy is most like the monarchies of old, where the ruler has full power over governance, with modern examples including Saudi Arabia and Vatican City.
Republics
Unlike monarchies, the people hold the power in a republic government system, directly electing representatives to form government. Again, there are multiple types of modern republic governments: presidential, semi-presidential, and parliamentary. The presidential republic could be considered a direct progression from monarchies. This system has a strong and independent chief executive with extensive powers when it comes to domestic affairs and foreign policy. An example of this is the United States, where the President is both the head of state and the head of government. In a semi-presidential republic, the president is the head of state and has some executive powers that are independent of the legislature. However, the prime minister (or chancellor or equivalent title) is the head of government, responsible to the legislature along with the cabinet. Russia is a classic example of this type of government. The last type of republic system is parliamentary. In this system, the president is a figurehead, while the head of government holds real power and is validated by and accountable to the parliament. This type of system can be seen in Germany, Italy, and India and is akin to constitutional monarchies. It’s also important to point out that some parliamentary republic systems operate slightly differently. For example in South Africa, the president is both the head of state and government, but is elected directly by the legislature. This leaves them (and their ministries) potentially subject to parliamentary confidence.
One-Party State
Many of the systems above involve multiple political parties vying to rule and govern their respective countries. In a one-party state, also called a single-party state or single-party system, only one political party has the right to form government. All other political parties are either outlawed or only allowed limited participation in elections. In this system, a country’s head of state and head of government can be executive or ceremonial but political power is constitutionally linked to a single political movement. China is the most well-known example of this government system, with the General Secretary of the Communist Party of China ruling as the de facto leader since 1989.
Provisional
The final form of government is a provisional government formed as an interim or transitional government. In this system, an emergency governmental body is created to manage political transitions after the collapse of a government, or when a new state is formed. Often these evolve into fully constitutionalized systems, but sometimes they hold power for longer than expected. Some examples of countries that are considered provisional include Libya, Burkina Faso, and Chad.