Because of its importance, commercial shipping relies on strategic trade routes to move goods efficiently. These waterways are used by thousands of vessels a year—but it’s not always smooth sailing. In fact, there are certain points along these routes that pose a risk to the whole system. Here’s a look at the world’s most vulnerable maritime bottlenecks—also known as choke points—as identified by GIS.
What’s a Choke Point?
Choke points are strategic, narrow passages that connect two larger areas to one another. When it comes to maritime trade, these are typically straits or canals that see high volumes of traffic because of their optimal location. Despite their convenience, these vital points pose several risks:
Structural risks: As demonstrated in the recent Suez Canal blockage, ships can crash along the shore of a canal if the passage is too narrow, causing traffic jams that can last for days. Geopolitical risks: Because of their high traffic, choke points are particularly vulnerable to blockades or deliberate disruptions during times of political unrest.
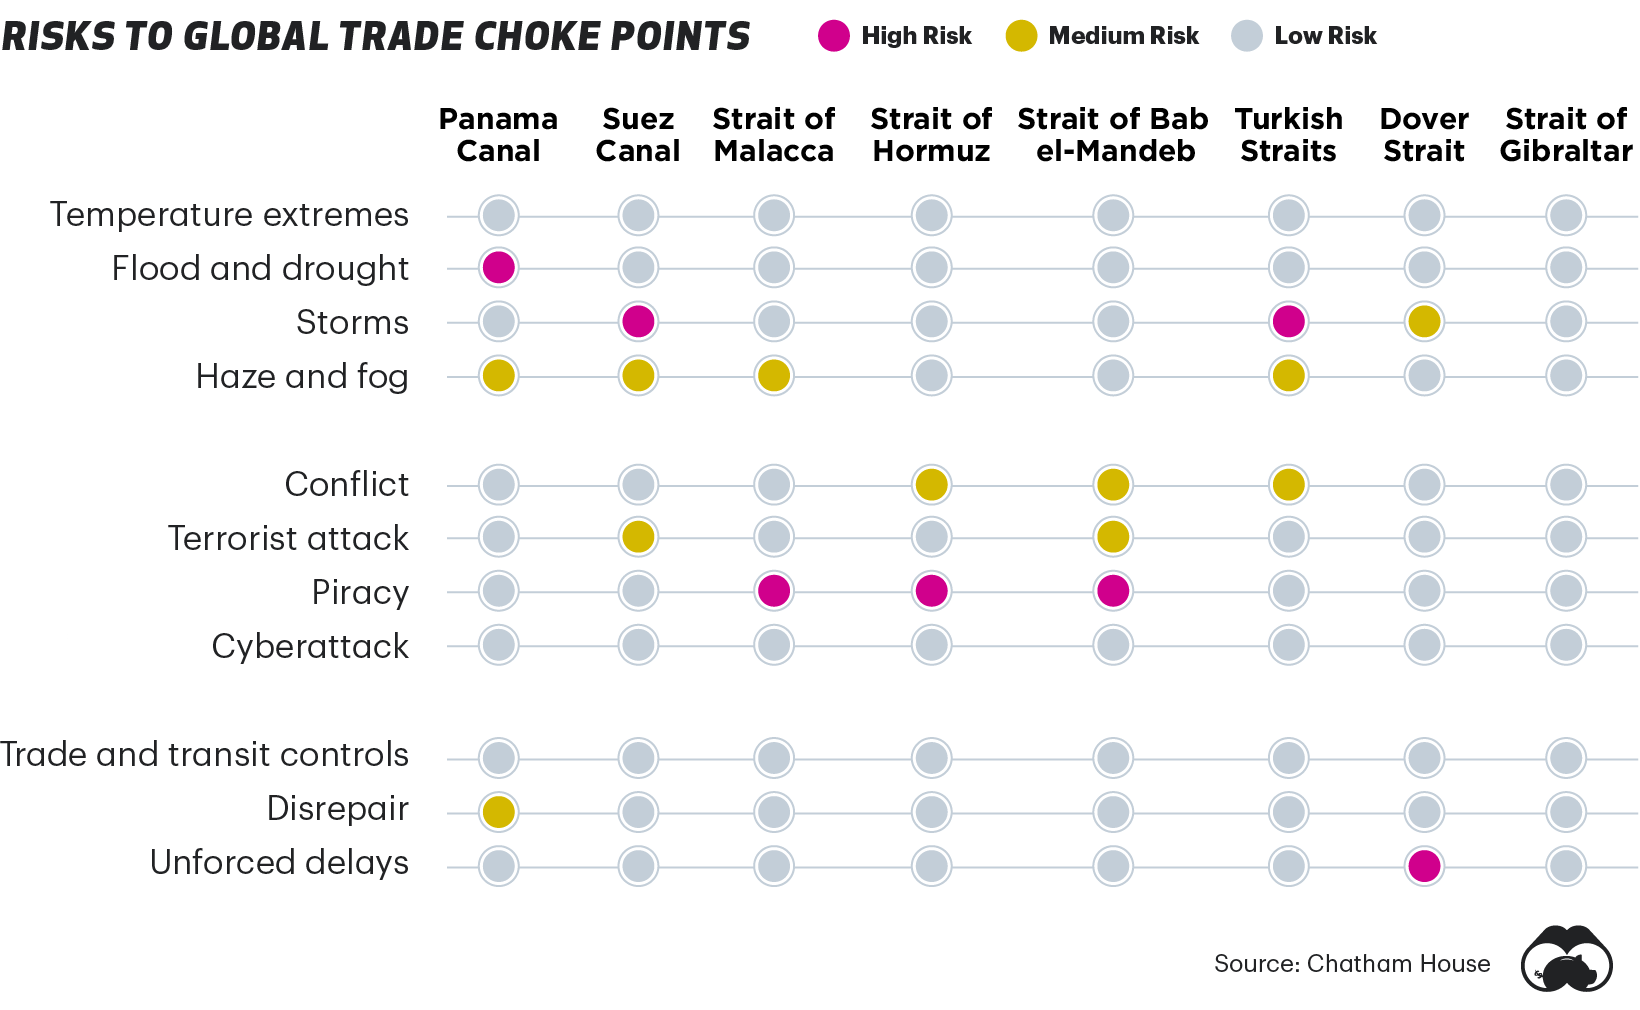
The type and degree of risk varies, depending on location. Here’s a look at some of the biggest threats, at eight of the world’s major choke points.
Because of their high risk, alternatives for some of these key routes have been proposed in the past—for instance, in 2013 Nicaraguan Congress approved a $40 billion dollar project proposal to build a canal that was meant to rival the Panama Canal. As of today, it has yet to materialize.
A Closer Look: Key Maritime Choke Points
Despite their vulnerabilities, these choke points remain critical waterways that facilitate international trade. Below, we dive into a few of the key areas to provide some context on just how important they are to global trade.
The Panama Canal
The Panama Canal is a lock-type canal that provides a shortcut for ships traveling between the Pacific and Atlantic oceans. Ships sailing between the east and west coasts of the U.S. save over 8,000 nautical miles by using the canal—which roughly shortens their trip by 21 days. In 2019, 252 million long tons of goods were transported through the Panama Canal, which generated over $2.6 billion in tolls.
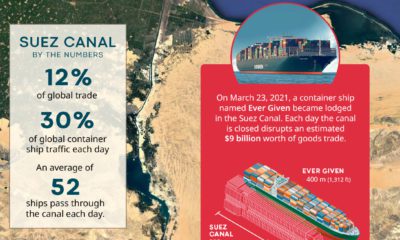
The Suez Canal
The Suez Canal is an Egyptian waterway that connects Europe to Asia. Without this route, ships would need to sail around Africa, which would add approximately seven days to their trips. In 2019, nearly 19,000 vessels, and 1 billion tons of cargo, traveled through the Suez Canal. In an effort to mitigate risk, the Egyptian government embarked on a major expansion project for the canal back in 2015. But, given the recent blockage caused by a Taiwanese container ship, it’s clear that the waterway is still vulnerable to obstruction.
The Strait of Malacca
At its smallest point, the Strait of Malacca is approximately 1.5 nautical miles, making it one of the world’s narrowest choke points. Despite its size, it’s one of Asia’s most critical waterways, since it provides a critical connection between China, India, and Southeast Asia. This choke point creates a risky situation for the 130,000 or so ships that visit the Port of Singapore each year. The area is also known to have problems with piracy—in 2019, there were 30 piracy incidents, according to private information group ReCAAP ISC.
The Strait of Hormuz
Controlled by Iran, the Strait of Hormuz links the Persian Gulf to the Gulf of Oman, ultimately draining into the Arabian Sea. It’s a primary vein for the world’s oil supply, transporting approximately 21 million barrels per day. Historically, it’s also been a site of regional conflict. For instance, tankers and commercial ships were attacked in that area during the Iran-Iraq war in the 1980s.
The Bab el-Mandeb Strait
The Bab el-Mandeb Strait is another primary waterway for the world’s oil and natural gas. Nestled between Africa and the Middle East, the critical route connects the Mediterranean Sea (via the Suez Canal) to the Indian Ocean. Like the Strait of Malacca, it’s well known as a high-risk area for pirate attacks. In May 2020, a UK chemical tanker was attacked off the coast of Yemen–the ninth pirate attack in the area that year. Due to the strategic nature of the region, there is a strong military presence in nearby Djibouti, including China’s first ever foreign military base. on Last year, stock and bond returns tumbled after the Federal Reserve hiked interest rates at the fastest speed in 40 years. It was the first time in decades that both asset classes posted negative annual investment returns in tandem. Over four decades, this has happened 2.4% of the time across any 12-month rolling period. To look at how various stock and bond asset allocations have performed over history—and their broader correlations—the above graphic charts their best, worst, and average returns, using data from Vanguard.
How Has Asset Allocation Impacted Returns?
Based on data between 1926 and 2019, the table below looks at the spectrum of market returns of different asset allocations:
We can see that a portfolio made entirely of stocks returned 10.3% on average, the highest across all asset allocations. Of course, this came with wider return variance, hitting an annual low of -43% and a high of 54%.
A traditional 60/40 portfolio—which has lost its luster in recent years as low interest rates have led to lower bond returns—saw an average historical return of 8.8%. As interest rates have climbed in recent years, this may widen its appeal once again as bond returns may rise.
Meanwhile, a 100% bond portfolio averaged 5.3% in annual returns over the period. Bonds typically serve as a hedge against portfolio losses thanks to their typically negative historical correlation to stocks.
A Closer Look at Historical Correlations
To understand how 2022 was an outlier in terms of asset correlations we can look at the graphic below:
The last time stocks and bonds moved together in a negative direction was in 1969. At the time, inflation was accelerating and the Fed was hiking interest rates to cool rising costs. In fact, historically, when inflation surges, stocks and bonds have often moved in similar directions. Underscoring this divergence is real interest rate volatility. When real interest rates are a driving force in the market, as we have seen in the last year, it hurts both stock and bond returns. This is because higher interest rates can reduce the future cash flows of these investments. Adding another layer is the level of risk appetite among investors. When the economic outlook is uncertain and interest rate volatility is high, investors are more likely to take risk off their portfolios and demand higher returns for taking on higher risk. This can push down equity and bond prices. On the other hand, if the economic outlook is positive, investors may be willing to take on more risk, in turn potentially boosting equity prices.
Current Investment Returns in Context
Today, financial markets are seeing sharp swings as the ripple effects of higher interest rates are sinking in. For investors, historical data provides insight on long-term asset allocation trends. Over the last century, cycles of high interest rates have come and gone. Both equity and bond investment returns have been resilient for investors who stay the course.