Understandably, this has a lot of people worried. In June 2022, Insight Global found that 78% of American workers fear they will lose their job in the next recession. Additionally, 56% said they aren’t financially prepared, and 54% said they would take a pay cut to avoid being laid off. In this infographic, we’ve visualized major layoffs announced in 2022 by publicly-traded U.S. corporations. Note: Due to gaps in reporting, as well as the very large number of U.S. corporations, this list may not be comprehensive.
An Emerging Trend
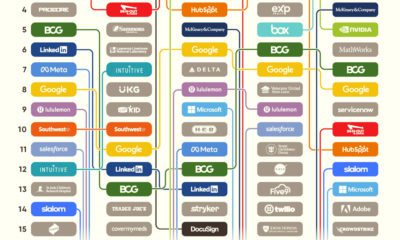
Layoffs have surged considerably since April of this year. See the table below for high-profile instances of mass layoffs. Here’s a brief rundown of these layoffs, sorted by industry.
Automotive
Ford has announced the biggest round of layoffs this year, totalling roughly 8,000 salaried employees. Many of these jobs are in Ford’s legacy combustion engine business. According to CEO Jim Farley, these cuts are necessary to fund the company’s transition to EVs. Speaking of EVs, Rivian laid off 840 employees in July, amounting to 6% of its total workforce. The EV startup pointed to inflation, rising interest rates, and increasing commodity prices as factors. The firm’s more established competitor, Tesla, cut 200 jobs from its autopilot division in the month prior. Last but not least is online used car retailer, Carvana, which cut 2,500 jobs in May. The company experienced rapid growth during the pandemic, but has since fallen out of grace. Year-to-date, the company’s shares are down more than 80%.
Financial Services
Fearing an impending recession, Coinbase has shed 1,100 employees, or 18% of its total workforce. Interestingly, Coinbase does not have a physical headquarters, meaning the entire company operates remotely. Around the same time, JPMorgan Chase & Co. announced it would fire hundreds of home-lending employees. While an exact number isn’t available, we’ve estimated this to be around 500 jobs, based on the original Bloomberg article. Wells Fargo, another major U.S. bank, has also cut 197 jobs from its home mortgage division. The primary reason for these cuts is rising mortgage rates, which are negatively impacting the demand for homes.
Technology
Within tech, Meta and Twitter are two of the most high profile companies to begin making layoffs. In Meta’s case, 350 custodial staff have been let go due to reduced usage of the company’s offices. Many more cuts are expected, however, as Facebook recently reported its first revenue decline in 10 years. CEO Mark Zuckerberg has made it clear he expects the company to do more with fewer resources, and managers have been encouraged to report “low performers” for “failing the company”. Also in July, Twitter laid off 30% of its talent acquisition team. An exact number was not available, but the team was estimated to have less than 100 employees. The company has also enacted a hiring freeze as it stumbles through a botched acquisition by Elon Musk.
More Layoffs to Come…
Layoffs are expected to continue throughout the rest of this year, as metrics like consumer sentiment enter a decline. Rising interest rates, which make it more expensive for businesses to borrow money, are also having a negative impact on growth. In fact just a few days ago, trading platform Robinhood announced it was letting go 23% of its staff. After accounting for its previous layoffs in April (9% of the workforce), it’s fair to estimate that this latest round will impact nearly 800 people. on Last year, stock and bond returns tumbled after the Federal Reserve hiked interest rates at the fastest speed in 40 years. It was the first time in decades that both asset classes posted negative annual investment returns in tandem. Over four decades, this has happened 2.4% of the time across any 12-month rolling period. To look at how various stock and bond asset allocations have performed over history—and their broader correlations—the above graphic charts their best, worst, and average returns, using data from Vanguard.
How Has Asset Allocation Impacted Returns?
Based on data between 1926 and 2019, the table below looks at the spectrum of market returns of different asset allocations:
We can see that a portfolio made entirely of stocks returned 10.3% on average, the highest across all asset allocations. Of course, this came with wider return variance, hitting an annual low of -43% and a high of 54%.
A traditional 60/40 portfolio—which has lost its luster in recent years as low interest rates have led to lower bond returns—saw an average historical return of 8.8%. As interest rates have climbed in recent years, this may widen its appeal once again as bond returns may rise.
Meanwhile, a 100% bond portfolio averaged 5.3% in annual returns over the period. Bonds typically serve as a hedge against portfolio losses thanks to their typically negative historical correlation to stocks.
A Closer Look at Historical Correlations
To understand how 2022 was an outlier in terms of asset correlations we can look at the graphic below:
The last time stocks and bonds moved together in a negative direction was in 1969. At the time, inflation was accelerating and the Fed was hiking interest rates to cool rising costs. In fact, historically, when inflation surges, stocks and bonds have often moved in similar directions. Underscoring this divergence is real interest rate volatility. When real interest rates are a driving force in the market, as we have seen in the last year, it hurts both stock and bond returns. This is because higher interest rates can reduce the future cash flows of these investments. Adding another layer is the level of risk appetite among investors. When the economic outlook is uncertain and interest rate volatility is high, investors are more likely to take risk off their portfolios and demand higher returns for taking on higher risk. This can push down equity and bond prices. On the other hand, if the economic outlook is positive, investors may be willing to take on more risk, in turn potentially boosting equity prices.
Current Investment Returns in Context
Today, financial markets are seeing sharp swings as the ripple effects of higher interest rates are sinking in. For investors, historical data provides insight on long-term asset allocation trends. Over the last century, cycles of high interest rates have come and gone. Both equity and bond investment returns have been resilient for investors who stay the course.