While this energy mix is still dominated by fossil fuels, there are signs of a steady shift to renewable energy over the past decade. This radial Sankey diagram using data from the EIA (Energy Information Administration) breaks down U.S. energy consumption in 2020, showing us how much each sector relies on various energy sources.
The Balance of Energy Production and Consumption
In 2019 and now in 2020, America’s domestic energy production has actually been greater than its consumption—a development that hasn’t taken place since 1957.
Last year’s numbers were severely impacted by the COVID-19 pandemic, seeing a 5% drop in energy production and a 7% drop in consumption compared to 2019. Total energy production and consumption for 2020 came in at 95.75 and 92.94 quads respectively.
The energy amounts are equalized and measured in quadrillion BTUs (British thermal units), also known as quads. A quad is a huge amount of energy, equivalent to 183 million barrels of petroleum or 36 million tonnes of coal.
So how is America’s overall energy production and consumption split between energy sources?
U.S. Energy Production and Consumption Share by Source
Source: IEA America’s new margin of energy production over consumption has resulted in the country being a net total energy exporter again, providing some flexibility as the country continues its transition towards more sustainable and renewable energy sources.
Fossil Fuels Still Dominate U.S. Energy Consumption
While America’s mix of energy consumption is fairly diverse, 79% of domestic energy consumption still originates from fossil fuels. Petroleum powers over 90% of the transportation sector’s consumption, and natural gas and petroleum make up 74% of the industrial sector’s direct energy consumption. There are signs of change as consumption of the dirtiest fossil fuel, coal, has declined more than 58% since its peak in 2005. Coinciding with this declining coal dependence, consumption from renewable energy has increased for six years straight, setting record highs again in 2020. However, fossil fuels still make up 79% of U.S. energy consumption, with renewables and nuclear accounting for the remaining 21%. The table below looks at the share of specific renewable energy sources in 2020.
Distribution of Renewable Energy Sources
Source: IEA
The Nuclear Necessity for a Zero-Emission Energy Transition
It’s not all up to renewable energy sources to clean up America’s energy mix, as nuclear power will play a vital role in reducing carbon emissions. Technically not a renewable energy source due to uranium’s finite nature, nuclear energy is still a zero-emission energy that has provided around 20% of total annual U.S. electricity since 1990. Support for nuclear power has been growing slowly, and last year was the first which saw nuclear electricity generation overtake coal. However, this might not last as three nuclear plants including New York’s Indian Point nuclear plant are set to be decommissioned in 2021, with a fourth plant scheduled for retirement in 2022. It’s worth noting that while other countries might have a higher share of nuclear energy in their total electricity generation, the U.S. still has the largest nuclear generation capacity worldwide and has generated more nuclear electricity than any other country in the world.
Converting Energy to Electricity
The energy produced by nuclear power plants doesn’t go directly to its end-use sector, rather, 100% of nuclear energy in the U.S. is converted to electricity which is sold to consumers. Along with nuclear, most energy sources aside from petroleum are primarily converted to electricity. Unfortunately, electricity conversion is a fairly inefficient process, with around 65% of the energy lost in the conversion, transmission, and distribution of electricity. This necessary but wasteful step allows for the storage of energy in electrical form, ensuring that it can be distributed properly. Working towards more efficient methods of energy to electricity conversion is an often forgotten aspect of reducing wasted energy. Despite the dip in 2020, both energy production and consumption in the U.S. are forecasted to continue rising. As Biden aims to reduce greenhouse gas emissions by 50% by 2030 (from 2005 emission levels), U.S. energy consumption will inevitably continue to shift away from fossil fuels and towards renewable and nuclear energy. on
#1: High Reliability
Nuclear power plants run 24/7 and are the most reliable source of sustainable energy. Nuclear electricity generation remains steady around the clock throughout the day, week, and year. Meanwhile, daily solar generation peaks in the afternoon when electricity demand is usually lower, and wind generation depends on wind speeds.As the use of variable solar and wind power increases globally, nuclear offers a stable and reliable backbone for a clean electricity grid.
#2: Clean Electricity
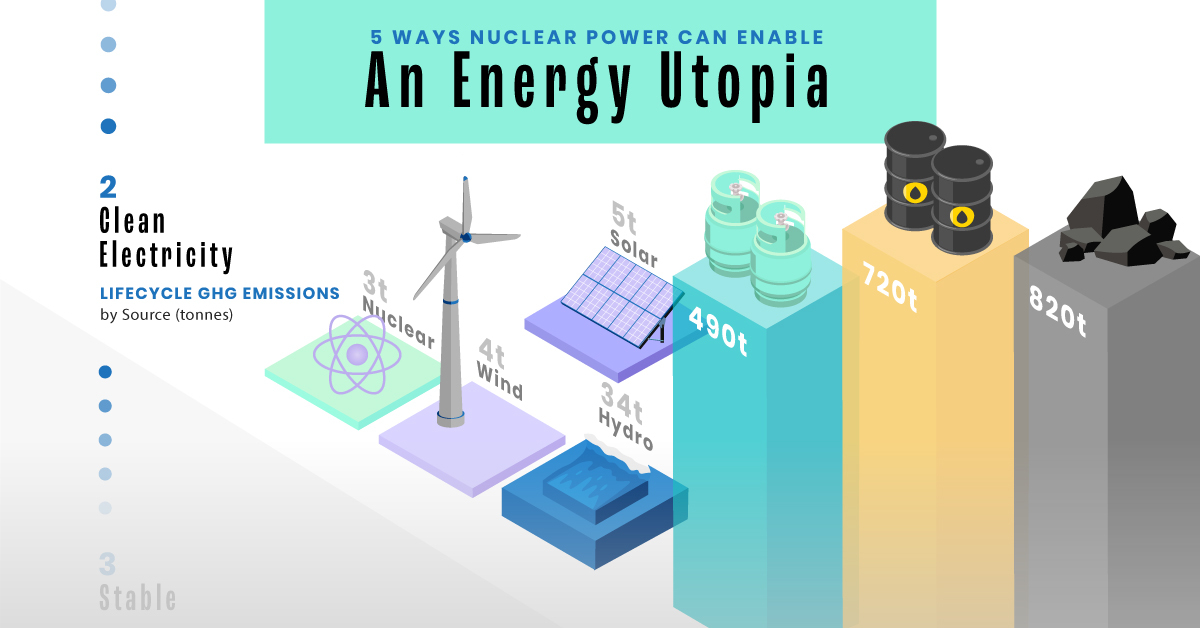
Nuclear reactors use fission to generate electricity without any greenhouse gas (GHG) emissions.Consequently, nuclear power is the cleanest energy source on a lifecycle basis, measured in CO2-equivalent emissions per gigawatt-hour (GWh) of electricity produced by a power plant over its lifetime. The lifecycle emissions from a typical nuclear power plant are 273 times lower than coal and 163 times lower than natural gas. Furthermore, nuclear is relatively less resource-intensive, allowing for lower supply chain emissions than wind and solar plants.
#3: Stable Affordability
Although nuclear plants can be expensive to build, they are cost-competitive in the long run. Most nuclear plants have an initial lifetime of around 40 years, after which they can continue operating with approved lifetime extensions. Nuclear plants with lifetime extensions are the cheapest sources of electricity in the United States, and 88 of the country’s 92 reactors have received approvals for 20-year extensions. Additionally, according to the World Nuclear Association, nuclear plants are relatively less susceptible to fuel price volatility than natural gas plants, allowing for stable costs of electricity generation.
#4: Energy Efficiency
Nuclear’s high energy return on investment (EROI) exemplifies its exceptional efficiency. EROI measures how many units of energy are returned for every unit invested in building and running a power plant, over its lifetime. According to a 2018 study by Weissbach et al., nuclear’s EROI is 75 units, making it the most efficient energy source by some distance, with hydropower ranking second at 35 units.
#5: Sustainable Innovation
New, advanced reactor designs are bypassing many of the difficulties faced by traditional nuclear plants, making nuclear power more accessible.
Small Modular Reactors (SMRs) are much smaller than conventional reactors and are modular—meaning that their components can be transported and assembled in different locations. Microreactors are smaller than SMRs and are designed to provide electricity in remote and small market areas. They can also serve as backup power sources during emergencies.
These reactor designs offer several advantages, including lower initial capital costs, portability, and increased scalability.
A Nuclear-Powered Future
Nuclear power is making a remarkable comeback as countries work to achieve climate goals and ultimately, a state of energy utopia. Besides the 423 reactors in operation worldwide, another 56 reactors are under construction, and at least 69 more are planned for construction. Some nations, like Japan, have also reversed their attitudes toward nuclear power, embracing it as a clean and reliable energy source for the future. CanAlaska is a leading exploration company in the Athabasca Basin, the Earth’s richest uranium depository. Click here to learn more now. In part 3 of the Road to Energy Utopia series, we explore the unique properties of uranium, the fuel that powers nuclear reactors.


