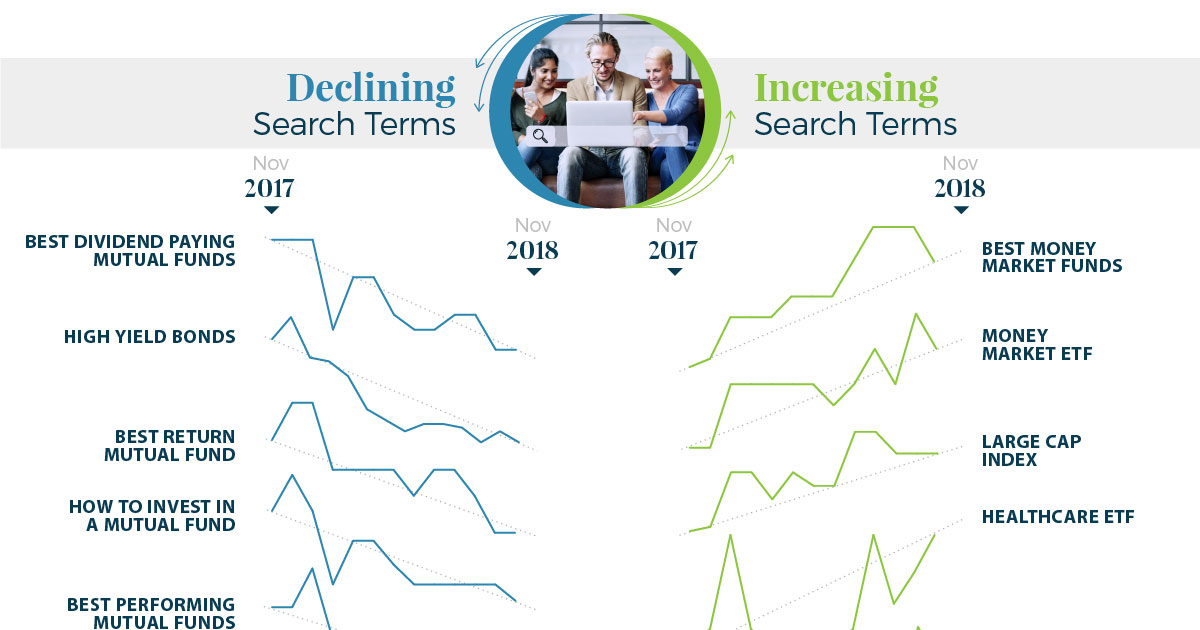
Whether it is something as simple as searching for “S&P 500 today” or it’s more of an information-finding mission to discover the “Best Dividend Paying Mutual Fund”, search data provides an interesting lens with which to view the topics investors are focused on.
Investor Search Data
Today’s infographic comes to us from New York Life Investments, and it shows investor searches for various investment-related keyphrases by month. The data starts in January 2017 and goes until November 2018, giving an almost two-year picture into investor search patterns. It enables us to see macro trends of which searches are becoming more popular, as well as a window into certain time periods in which behavior changed dramatically. Not only can we see increases or decreases in searches for specific keyphrases year-over-year, but we can also see how patterns changed when the market went into corrections or saw increased levels of volatility.
The Macro Picture
Here is a data-driven look at wider categories of search phrases, showing which terms saw the biggest increases or decreases year-over-year.
In terms of general investing strategy, it seems investors were increasingly looking at how to build a “balanced” strategy, rather than having an “aggressive” allocation. The latter was much more popular in 2017.
Looking at more generic keyphrases, people have been increasingly looking for “simple” investments.
Investors looked more for “large cap index”, as well as the current status of the S&P 500. Further, they wanted to know less about “Growth mutual funds”, “Absolute return funds”, and “Small cap value funds”.
Lastly, on the ETF front, investors wanted to know more about “Money market ETF” as well as “Emerging markets value ETF” and “Short term bond ETF”. On the opposite side, fewer investors needed to know the definition of an exchange traded fund. on These are in the form of Treasury securities, some of the most liquid assets worldwide. Central banks use them for foreign exchange reserves and private investors flock to them during flights to safety thanks to their perceived low default risk. Beyond these reasons, foreign investors may buy Treasuries as a store of value. They are often used as collateral during certain international trade transactions, or countries can use them to help manage exchange rate policy. For example, countries may buy Treasuries to protect their currency’s exchange rate from speculation. In the above graphic, we show the foreign holders of the U.S. national debt using data from the U.S. Department of the Treasury.
Top Foreign Holders of U.S. Debt
With $1.1 trillion in Treasury holdings, Japan is the largest foreign holder of U.S. debt. Japan surpassed China as the top holder in 2019 as China shed over $250 billion, or 30% of its holdings in four years. This bond offloading by China is the one way the country can manage the yuan’s exchange rate. This is because if it sells dollars, it can buy the yuan when the currency falls. At the same time, China doesn’t solely use the dollar to manage its currency—it now uses a basket of currencies. Here are the countries that hold the most U.S. debt: As the above table shows, the United Kingdom is the third highest holder, at over $655 billion in Treasuries. Across Europe, 13 countries are notable holders of these securities, the highest in any region, followed by Asia-Pacific at 11 different holders. A handful of small nations own a surprising amount of U.S. debt. With a population of 70,000, the Cayman Islands own a towering amount of Treasury bonds to the tune of $284 billion. There are more hedge funds domiciled in the Cayman Islands per capita than any other nation worldwide. In fact, the four smallest nations in the visualization above—Cayman Islands, Bermuda, Bahamas, and Luxembourg—have a combined population of just 1.2 million people, but own a staggering $741 billion in Treasuries.
Interest Rates and Treasury Market Dynamics
Over 2022, foreign demand for Treasuries sank 6% as higher interest rates and a strong U.S. dollar made owning these bonds less profitable. This is because rising interest rates on U.S. debt makes the present value of their future income payments lower. Meanwhile, their prices also fall. As the chart below shows, this drop in demand is a sharp reversal from 2018-2020, when demand jumped as interest rates hovered at historic lows. A similar trend took place in the decade after the 2008-09 financial crisis when U.S. debt holdings effectively tripled from $2 to $6 trillion.
Driving this trend was China’s rapid purchase of Treasuries, which ballooned from $100 billion in 2002 to a peak of $1.3 trillion in 2013. As the country’s exports and output expanded, it sold yuan and bought dollars to help alleviate exchange rate pressure on its currency. Fast-forward to today, and global interest-rate uncertainty—which in turn can impact national currency valuations and therefore demand for Treasuries—continues to be a factor impacting the future direction of foreign U.S. debt holdings.