Things took a drastic turn on April 19, 2022, when Netflix announced its Q1 results. Rather than gaining subscribers as forecasted, the company lost 200,000. This was the first decline in over a decade, and investors rushed to pull their money out. So, is there a buying opportunity now that Netflix shares are trading at multi-year lows? To help you decide, we’ve provided further context around this historic crash.
Netflix Shares Fall Flat
Over the span of a few months, Netflix shares have erased roughly four years worth of gains. Not all of these losses are due to the drop in subscribers, however. Prior to the Q1 earnings announcement, Netflix had lost most of its pandemic-related gains. This was primarily due to rising interest rates and people spending less time at home. Still, analysts expected Netflix to add 2.7 million subscribers. After announcing it had lost 200,000 subscribers instead, the stock quickly fell below $200 (the first time since late 2017). YTD performance (as of April 29, 2022) is an abysmal -67%.
What’s to Blame?
Netflix pointed to three culprits for its loss in subscribers:
The suspension of its services in Russia Increasing competition Account sharing
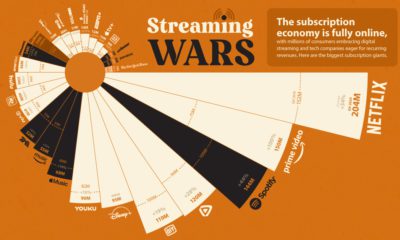
Let’s focus on the latter two, starting with competition. The following table compares the number of subscribers between Netflix and two prominent rivals: Disney+ and HBO. Disney+ was launched in November 2019, while HBO Max was launched in May 2020. HBO (the channel) and HBO Max subscribers are rolled up as one. Based on this data, Netflix may be starting to feel the heat of competition. A loss in subscribers is bad news, but it’s even worse when competitors report growth over the same time period. Keep in mind that we’re only talking about a single quarter, and not a long-term trend. It’s too early to say whether Netflix is actually losing ground, though the company has warned it could shed another 2 million subscribers by July. Next is account sharing, which according to Netflix, amounts to 100 million non-paying households. This is spread out across the entire world, but if we use the company’s U.S. pricing as a benchmark, it translates to between $1 to $2 billion in lost revenue.
Growth is Everything
In the tech sector, growth is everything. If Netflix can’t return to posting consecutive quarters of subscriber growth, it could be many years before the stock returns to its previous high. Regaining that momentum is going to be difficult, but Netflix does have plans. To address password sharing, the service may charge a fee for out-of-household profiles that are added to an account. The specifics around enforcement are vague, but Netflix is also considering a lower-priced subscription plan that includes advertising. Only time will tell if these strategies can stop the bleeding, or perhaps even boost profitability. Rampant inflation, which might persuade consumers to cut down on their subscriptions, could be a source of additional headwinds. on Last year, stock and bond returns tumbled after the Federal Reserve hiked interest rates at the fastest speed in 40 years. It was the first time in decades that both asset classes posted negative annual investment returns in tandem. Over four decades, this has happened 2.4% of the time across any 12-month rolling period. To look at how various stock and bond asset allocations have performed over history—and their broader correlations—the above graphic charts their best, worst, and average returns, using data from Vanguard.
How Has Asset Allocation Impacted Returns?
Based on data between 1926 and 2019, the table below looks at the spectrum of market returns of different asset allocations:
We can see that a portfolio made entirely of stocks returned 10.3% on average, the highest across all asset allocations. Of course, this came with wider return variance, hitting an annual low of -43% and a high of 54%.
A traditional 60/40 portfolio—which has lost its luster in recent years as low interest rates have led to lower bond returns—saw an average historical return of 8.8%. As interest rates have climbed in recent years, this may widen its appeal once again as bond returns may rise.
Meanwhile, a 100% bond portfolio averaged 5.3% in annual returns over the period. Bonds typically serve as a hedge against portfolio losses thanks to their typically negative historical correlation to stocks.
A Closer Look at Historical Correlations
To understand how 2022 was an outlier in terms of asset correlations we can look at the graphic below:
The last time stocks and bonds moved together in a negative direction was in 1969. At the time, inflation was accelerating and the Fed was hiking interest rates to cool rising costs. In fact, historically, when inflation surges, stocks and bonds have often moved in similar directions. Underscoring this divergence is real interest rate volatility. When real interest rates are a driving force in the market, as we have seen in the last year, it hurts both stock and bond returns. This is because higher interest rates can reduce the future cash flows of these investments. Adding another layer is the level of risk appetite among investors. When the economic outlook is uncertain and interest rate volatility is high, investors are more likely to take risk off their portfolios and demand higher returns for taking on higher risk. This can push down equity and bond prices. On the other hand, if the economic outlook is positive, investors may be willing to take on more risk, in turn potentially boosting equity prices.
Current Investment Returns in Context
Today, financial markets are seeing sharp swings as the ripple effects of higher interest rates are sinking in. For investors, historical data provides insight on long-term asset allocation trends. Over the last century, cycles of high interest rates have come and gone. Both equity and bond investment returns have been resilient for investors who stay the course.
